Introduction
Advances in artificial intelligence (AI) could potentially reshape business processes and increase productivity (e.g., Filippucci et al. 2024). The adoption of disruptive AI technologies remains in its early stages but is accelerating (e.g., Do et al. 2026), and as AI adoption expands, so do concerns surrounding impacts on employment. However, empirical evidence so far reveals a nuanced story. Although AI could be changing the way some people work in Canada (Hahmann and Lovei 2026; Statistics Canada 2026a), Mehdi and Frenette (2026) found no broad evidence of a structural break in employment trends following the public launch of ChatGPT in November 2022 or of diverging trends based on the occupations’ potential exposure to and complementarity with AI.Note
Mehdi and Frenette (2026) focused on employment and job vacancy growth (labour market stock measures). However, the economy experiences substantial labour reallocation. Workers leave firms for better job opportunities. Employers hire or downsize in response to changing technologies, trade patterns, demographics and other factors. Hiring and job separation rates are flow measures that could provide a fuller picture of labour market dynamics and early signals that may not yet be visible in aggregate employment numbers. For instance, the absence of net changes in employment in some occupations might mask a decline in hiring matched by a decline in quit rates triggered by workers’ concerns about employment opportunities (or lack thereof).
There is ongoing debate regarding which groups of workers could be impacted by AI. One hypothesis is that AI could make existing workers more productive, thus reducing the need to hire new workers (e.g., Davenport and Srinivasan 2026), particularly for entry-level roles (e.g., Brynjolfsson et al. 2025; Hosseini Maasoum and Lichtinger 2025). Conversely, by making some groups of workers potentially more productive, AI might induce firms to hire more of these workers.Note
This article examines hiring and job separation rates for employees aged 15 to 64 in Canada using Labour Force Survey (LFS) data from January 2006 to August 2026, distinguishing jobs based on their potential occupational exposure to and complementarity with AI. It does so using the complementarity-adjusted AI occupational exposure (C-AIOE) index.
The hiring rate measures the share of newly hired employees in a given month.Note New hires are identified as LFS respondents who reported a tenure of one month. Job separation rates measure the share of employees who separated from their employer in a given month for any reason. Separations are calculated as new hires minus the net change in paid employment between the current and the previous month (Morissette et al. 2013; 2016).
The C-AIOE index was developed in the United States by Felten et al. (2021) and Pizzinelli et al. (2023). It has been applied to Canadian data in a number of articles (e.g., Mehdi and Morissette 2024; Mehdi and Frenette 2024; Mehdi and Frenette 2026; Mehdi et al. 2026; Leanage and Mehdi 2026; Li and Dobbs 2025).
Hiring rates for younger workers have generally declined over the past five years regardless of potential occupational exposure to artificial intelligence
The hiring rate for employees aged 15 to 29 in occupations potentially highly exposed to and highly complementary (HEHC) with AI—jobs potentially more amenable to AI augmentation as opposed to substitution—edged down from 2.9% in the six months leading up to November 2022 to 2.5% in the six months leading up to August 2026 (Chart 1). Over the same period, this rate edged down from 3.2% to 3.0% in occupations potentially highly exposed to and less complementary (HELC) with AI—jobs potentially more amenable to AI substitution. A more sustained slowdown in hirings was observed in occupations potentially less exposed (LE) to AI, where the rate decreased from 4.0% in the six months leading up to November 2022 to 3.3% in the six months leading up to August 2026.Note Hiring rates in coding-intensive occupations—a subset of HELC jobs—decreased from 2.5% to 1.9%.
Data table for Chart 1
| 15 to 29 years | 30 to 49 years | 50 to 64 years | ||||||||||
|---|---|---|---|---|---|---|---|---|---|---|---|---|
| High-exposure and high-complementarity occupations | High-exposure and low-complementarity occupations | Low-exposure occupations | Coding-intensive occupations (a subset of high-exposure and low-complementarity occupations) | High-exposure and high-complementarity occupations | High-exposure and low-complementarity occupations | Low-exposure occupations | Coding-intensive occupations (a subset of high-exposure and low-complementarity occupations) | High-exposure and high-complementarity occupations | High-exposure and low-complementarity occupations | Low-exposure occupations | Coding-intensive occupations (a subset of high-exposure and low-complementarity occupations) | |
| percent | ||||||||||||
| Notes: The dashed vertical line demarcates the public release of ChatGPT in November 2022, which led to the mass availability of generative artificial intelligence (AI) technologies. The sample consisted of employees aged 15 to 64 living in Canada’s 10 provinces. The hiring rate measures the number of newly hired employees as a share of all employees. Potential occupational exposure to and complementarity with AI was measured using the complementarity-adjusted AI occupational exposure index developed by Felten et al. (2021) and Pizzinelli et al. (2023). High-exposure and high-complementarity occupations are those that are potentially more amenable to AI augmentation rather than substitution. High-exposure and low-complementarity occupations are those that are potentially more vulnerable to AI substitution. Low-exposure occupations are those that are potentially less exposed to AI. The following 2021 National Occupational Classification job titles were selected as coding-intensive occupations, which are a subset of high-exposure and low-complementarity occupations: data scientists, cybersecurity specialists, business systems specialists, information systems specialists, database analysts and data administrators, computer systems developers and programmers, software engineers and designers, software developers and programmers, web designers, and web developers and programmers. Sources: Statistics Canada, Labour Force Survey; and Occupational Information Network. |
||||||||||||
| 2006 | ||||||||||||
| January | 2.8 | 4.0 | 5.2 | 3.7 | 0.7 | 1.1 | 0.7 | 1.6 | 0.6 | 0.8 | 1.1 | 0.3 |
| February | 2.8 | 4.0 | 5.2 | 4.2 | 0.7 | 1.1 | 0.6 | 1.6 | 0.6 | 0.7 | 1.2 | 0.2 |
| March | 2.9 | 4.0 | 5.4 | 3.5 | 0.7 | 1.2 | 0.7 | 1.6 | 0.6 | 0.8 | 1.1 | 0.1 |
| April | 2.8 | 3.9 | 5.4 | 2.9 | 0.7 | 1.1 | 0.6 | 1.5 | 0.5 | 0.8 | 1.1 | 0.2 |
| May | 2.9 | 3.9 | 5.3 | 2.7 | 0.7 | 1.1 | 0.8 | 1.5 | 0.5 | 0.8 | 1.1 | 0.2 |
| June | 2.8 | 3.9 | 5.2 | 2.2 | 0.8 | 1.1 | 0.9 | 1.5 | 0.6 | 0.7 | 1.1 | 0.6 |
| July | 2.8 | 3.8 | 5.3 | 2.3 | 0.8 | 1.1 | 0.9 | 1.5 | 0.5 | 0.7 | 1.1 | 0.6 |
| August | 2.9 | 3.8 | 5.2 | 2.1 | 0.8 | 1.1 | 1.1 | 1.5 | 0.5 | 0.8 | 1.0 | 0.6 |
| September | 2.9 | 3.6 | 5.2 | 2.4 | 0.7 | 1.1 | 1.0 | 1.5 | 0.5 | 0.8 | 1.0 | 0.8 |
| October | 2.9 | 3.6 | 5.2 | 2.3 | 0.8 | 1.1 | 0.9 | 1.5 | 0.6 | 0.7 | 1.0 | 0.6 |
| November | 2.8 | 3.6 | 5.1 | 3.0 | 0.7 | 1.1 | 0.8 | 1.5 | 0.6 | 0.7 | 1.1 | 0.7 |
| December | 2.9 | 3.6 | 5.2 | 2.6 | 0.8 | 1.2 | 0.7 | 1.6 | 0.5 | 0.7 | 1.0 | 0.3 |
| 2007 | ||||||||||||
| January | 2.9 | 3.7 | 5.3 | 2.7 | 0.8 | 1.2 | 0.7 | 1.7 | 0.5 | 0.7 | 1.0 | 0.3 |
| February | 2.9 | 3.7 | 5.2 | 2.9 | 0.8 | 1.2 | 0.5 | 1.7 | 0.6 | 0.7 | 1.0 | 0.3 |
| March | 2.8 | 3.9 | 5.1 | 2.7 | 0.8 | 1.1 | 0.4 | 1.8 | 0.6 | 0.7 | 1.0 | 0.1 |
| April | 2.9 | 4.0 | 5.3 | 2.6 | 0.8 | 1.2 | 0.3 | 1.8 | 0.6 | 0.8 | 1.0 | 0.1 |
| May | 2.9 | 4.1 | 5.4 | 1.9 | 0.8 | 1.2 | 0.5 | 1.8 | 0.6 | 0.8 | 1.0 | 0.4 |
| June | 2.9 | 4.1 | 5.4 | 1.8 | 0.7 | 1.2 | 0.6 | 1.8 | 0.6 | 0.9 | 1.0 | 0.4 |
| July | 2.9 | 4.1 | 5.3 | 1.8 | 0.7 | 1.2 | 0.6 | 1.8 | 0.7 | 0.8 | 1.0 | 0.4 |
| August | 2.7 | 4.2 | 5.3 | 2.1 | 0.7 | 1.2 | 0.7 | 1.8 | 0.7 | 0.7 | 1.0 | 0.4 |
| September | 2.8 | 4.4 | 5.4 | 2.5 | 0.7 | 1.3 | 1.0 | 1.8 | 0.7 | 0.8 | 1.1 | 0.4 |
| October | 2.5 | 4.3 | 5.0 | 2.4 | 0.7 | 1.2 | 1.0 | 1.7 | 0.6 | 0.8 | 1.0 | 0.6 |
| November | 2.5 | 4.1 | 4.9 | 2.1 | 0.6 | 1.2 | 0.8 | 1.7 | 0.6 | 0.7 | 1.0 | 0.2 |
| December | 2.5 | 4.2 | 4.8 | 2.4 | 0.7 | 1.2 | 0.7 | 1.6 | 0.6 | 0.7 | 1.0 | 0.2 |
| 2008 | ||||||||||||
| January | 2.5 | 4.1 | 4.9 | 2.1 | 0.7 | 1.2 | 0.7 | 1.6 | 0.5 | 0.7 | 1.0 | 0.6 |
| February | 2.6 | 4.0 | 4.9 | 1.5 | 0.7 | 1.2 | 0.7 | 1.5 | 0.4 | 0.7 | 0.9 | 0.7 |
| March | 3.0 | 3.7 | 4.9 | 1.5 | 0.7 | 1.2 | 0.6 | 1.5 | 0.4 | 0.8 | 1.0 | 1.0 |
| April | 3.2 | 3.9 | 5.0 | 2.1 | 0.7 | 1.2 | 1.0 | 1.6 | 0.4 | 0.8 | 1.1 | 1.0 |
| May | 3.2 | 4.0 | 5.1 | 2.2 | 0.7 | 1.2 | 1.1 | 1.7 | 0.4 | 0.8 | 1.1 | 1.0 |
| June | 3.2 | 4.1 | 5.4 | 2.3 | 0.7 | 1.2 | 1.2 | 1.7 | 0.4 | 0.8 | 1.2 | 1.0 |
| July | 3.2 | 4.1 | 5.2 | 2.0 | 0.7 | 1.2 | 1.2 | 1.8 | 0.4 | 0.9 | 1.2 | 1.0 |
| August | 3.2 | 4.0 | 5.0 | 2.1 | 0.7 | 1.2 | 1.1 | 1.8 | 0.5 | 1.0 | 1.2 | 0.9 |
| September | 2.8 | 4.3 | 5.0 | 1.8 | 0.7 | 1.2 | 1.0 | 1.8 | 0.4 | 1.0 | 1.2 | 0.6 |
| October | 2.6 | 4.3 | 5.1 | 1.5 | 0.7 | 1.2 | 0.6 | 1.8 | 0.5 | 1.1 | 1.2 | 0.4 |
| November | 2.6 | 4.4 | 5.3 | 1.7 | 0.8 | 1.2 | 0.6 | 1.8 | 0.5 | 1.1 | 1.3 | 0.5 |
| December | 2.6 | 4.3 | 5.1 | 1.5 | 0.7 | 1.2 | 0.5 | 1.8 | 0.5 | 1.3 | 1.2 | 0.5 |
| 2009 | ||||||||||||
| January | 2.6 | 4.3 | 5.1 | 1.7 | 0.8 | 1.2 | 0.6 | 1.9 | 0.5 | 1.2 | 1.3 | 0.1 |
| February | 2.5 | 4.2 | 5.3 | 1.5 | 0.7 | 1.2 | 0.6 | 1.8 | 0.5 | 1.2 | 1.3 | 0.6 |
| March | 2.5 | 3.9 | 5.1 | 1.2 | 0.8 | 1.2 | 1.0 | 1.8 | 0.5 | 1.1 | 1.3 | 0.6 |
| April | 2.4 | 3.6 | 5.0 | 1.1 | 0.7 | 1.1 | 1.0 | 1.8 | 0.4 | 1.0 | 1.2 | 0.7 |
| May | 2.2 | 3.4 | 4.6 | 1.3 | 0.7 | 1.1 | 1.0 | 1.7 | 0.4 | 1.0 | 1.1 | 1.0 |
| June | 2.3 | 3.3 | 4.6 | 1.3 | 0.7 | 1.1 | 1.0 | 1.7 | 0.5 | 0.8 | 1.2 | 1.0 |
| July | 2.3 | 3.2 | 4.6 | 2.2 | 0.7 | 1.1 | 1.0 | 1.8 | 0.4 | 0.8 | 1.1 | 0.9 |
| August | 2.2 | 3.2 | 4.3 | 2.4 | 0.7 | 1.1 | 1.0 | 1.7 | 0.4 | 0.7 | 1.1 | 0.4 |
| September | 2.1 | 3.2 | 4.3 | 2.5 | 0.7 | 1.0 | 0.8 | 1.7 | 0.5 | 0.7 | 1.1 | 0.4 |
| October | 2.4 | 3.3 | 4.5 | 2.4 | 0.7 | 1.0 | 0.8 | 1.8 | 0.5 | 0.7 | 1.2 | 0.5 |
| November | 2.4 | 3.4 | 4.5 | 2.6 | 0.7 | 1.0 | 0.7 | 1.8 | 0.5 | 0.6 | 1.3 | 0.2 |
| December | 2.6 | 3.4 | 4.7 | 2.6 | 0.7 | 1.0 | 0.7 | 1.8 | 0.5 | 0.6 | 1.2 | 0.2 |
| 2010 | ||||||||||||
| January | 2.6 | 3.5 | 4.8 | 2.5 | 0.7 | 1.0 | 0.7 | 1.7 | 0.5 | 0.7 | 1.3 | 0.1 |
| February | 2.7 | 3.8 | 5.1 | 2.7 | 0.8 | 1.0 | 0.8 | 1.9 | 0.5 | 0.7 | 1.3 | 0.1 |
| March | 2.7 | 4.0 | 5.2 | 2.9 | 0.8 | 1.1 | 0.6 | 1.9 | 0.5 | 0.8 | 1.3 | 0.1 |
| April | 2.6 | 4.0 | 5.2 | 3.1 | 0.8 | 1.1 | 0.6 | 1.9 | 0.5 | 0.8 | 1.3 | 0.0 |
| May | 2.7 | 3.9 | 5.2 | 2.9 | 0.8 | 1.1 | 0.6 | 1.8 | 0.5 | 0.8 | 1.2 | 0.2 |
| June | 2.4 | 4.0 | 5.0 | 3.0 | 0.8 | 1.1 | 0.9 | 1.9 | 0.5 | 0.8 | 1.3 | 0.2 |
| July | 2.4 | 4.0 | 5.0 | 2.9 | 0.8 | 1.1 | 0.7 | 1.9 | 0.5 | 0.7 | 1.2 | 0.2 |
| August | 2.5 | 4.0 | 5.0 | 3.2 | 0.7 | 1.1 | 1.0 | 1.8 | 0.4 | 0.7 | 1.2 | 0.5 |
| September | 2.6 | 3.9 | 5.0 | 3.6 | 0.7 | 1.1 | 1.0 | 1.8 | 0.4 | 0.7 | 1.3 | 0.6 |
| October | 2.6 | 3.9 | 5.0 | 3.8 | 0.8 | 1.1 | 1.2 | 1.8 | 0.4 | 0.7 | 1.3 | 0.6 |
| November | 2.6 | 3.9 | 5.1 | 3.5 | 0.8 | 1.1 | 1.3 | 1.8 | 0.4 | 0.8 | 1.4 | 0.4 |
| December | 2.6 | 4.2 | 5.1 | 3.0 | 0.8 | 1.1 | 0.9 | 1.8 | 0.4 | 0.8 | 1.4 | 0.4 |
| 2011 | ||||||||||||
| January | 2.6 | 4.1 | 5.0 | 2.6 | 0.8 | 1.2 | 0.9 | 1.8 | 0.4 | 0.8 | 1.3 | 0.4 |
| February | 2.5 | 4.0 | 4.9 | 1.8 | 0.7 | 1.1 | 0.7 | 1.8 | 0.5 | 0.8 | 1.4 | 0.6 |
| March | 2.4 | 4.0 | 4.8 | 1.9 | 0.7 | 1.1 | 0.6 | 1.8 | 0.5 | 0.9 | 1.2 | 0.7 |
| April | 2.5 | 4.0 | 4.7 | 1.2 | 0.7 | 1.1 | 0.6 | 1.8 | 0.5 | 0.9 | 1.2 | 0.7 |
| May | 2.5 | 4.1 | 4.7 | 1.8 | 0.7 | 1.2 | 0.6 | 1.8 | 0.6 | 0.9 | 1.2 | 0.6 |
| June | 2.6 | 3.8 | 4.9 | 1.9 | 0.7 | 1.2 | 0.8 | 1.8 | 0.5 | 0.9 | 1.2 | 0.6 |
| July | 2.8 | 3.8 | 5.0 | 2.1 | 0.7 | 1.2 | 1.0 | 1.8 | 0.6 | 0.9 | 1.2 | 0.6 |
| August | 2.7 | 3.7 | 5.1 | 4.0 | 0.7 | 1.2 | 0.9 | 1.8 | 0.5 | 0.9 | 1.1 | 0.2 |
| September | 2.8 | 3.7 | 5.1 | 3.8 | 0.8 | 1.2 | 1.0 | 1.8 | 0.5 | 0.9 | 1.1 | 0.3 |
| October | 3.0 | 3.7 | 5.1 | 4.1 | 0.8 | 1.1 | 0.8 | 1.8 | 0.5 | 0.8 | 1.2 | 0.3 |
| November | 3.0 | 3.7 | 5.1 | 4.2 | 0.7 | 1.1 | 0.7 | 1.8 | 0.5 | 0.7 | 1.1 | 0.3 |
| December | 2.8 | 3.7 | 5.0 | 4.4 | 0.9 | 1.1 | 0.6 | 1.8 | 0.5 | 0.7 | 1.1 | 0.3 |
| 2012 | ||||||||||||
| January | 2.8 | 3.7 | 4.9 | 4.8 | 0.9 | 1.1 | 0.6 | 1.8 | 0.5 | 0.6 | 1.1 | 0.4 |
| February | 2.9 | 3.6 | 4.7 | 3.3 | 0.8 | 1.1 | 0.9 | 1.8 | 0.5 | 0.6 | 1.1 | 0.4 |
| March | 2.9 | 3.6 | 4.8 | 3.2 | 0.8 | 1.0 | 0.7 | 1.9 | 0.5 | 0.6 | 1.2 | 0.1 |
| April | 2.9 | 3.6 | 5.1 | 2.9 | 0.8 | 1.0 | 1.0 | 1.9 | 0.5 | 0.7 | 1.2 | 0.1 |
| May | 2.9 | 3.6 | 5.1 | 2.8 | 0.9 | 1.0 | 0.9 | 1.9 | 0.5 | 0.7 | 1.2 | 0.1 |
| June | 3.0 | 3.6 | 5.0 | 2.6 | 0.7 | 0.9 | 1.0 | 1.9 | 0.5 | 0.7 | 1.2 | 0.1 |
| July | 2.9 | 3.7 | 5.1 | 2.2 | 0.7 | 1.0 | 0.9 | 1.9 | 0.4 | 0.8 | 1.2 | 0.1 |
| August | 2.9 | 3.8 | 5.3 | 1.9 | 0.7 | 1.0 | 0.7 | 1.8 | 0.4 | 0.8 | 1.2 | 0.1 |
| September | 2.8 | 3.8 | 5.1 | 1.6 | 0.7 | 1.1 | 0.9 | 1.8 | 0.4 | 0.8 | 1.2 | 0.1 |
| October | 2.7 | 3.6 | 4.8 | 1.7 | 0.6 | 1.0 | 0.6 | 1.7 | 0.4 | 0.8 | 1.1 | 0.3 |
| November | 2.5 | 3.5 | 4.6 | 2.2 | 0.6 | 1.0 | 0.6 | 1.6 | 0.5 | 0.8 | 1.1 | 0.3 |
| December | 2.5 | 3.6 | 4.5 | 2.7 | 0.5 | 1.0 | 0.5 | 1.5 | 0.4 | 0.8 | 1.1 | 0.3 |
| 2013 | ||||||||||||
| January | 2.5 | 3.6 | 4.6 | 2.9 | 0.6 | 1.1 | 0.8 | 1.7 | 0.4 | 0.7 | 1.1 | 0.3 |
| February | 2.6 | 3.6 | 4.6 | 3.3 | 0.6 | 1.1 | 0.7 | 1.7 | 0.4 | 0.7 | 1.1 | 0.3 |
| March | 2.6 | 3.5 | 4.5 | 3.1 | 0.6 | 1.0 | 0.6 | 1.7 | 0.4 | 0.7 | 1.1 | 0.3 |
| April | 2.5 | 3.6 | 4.6 | 4.0 | 0.6 | 1.1 | 0.8 | 1.7 | 0.4 | 0.6 | 1.2 | 0.2 |
| May | 2.6 | 3.7 | 4.7 | 3.3 | 0.7 | 1.2 | 0.9 | 1.9 | 0.4 | 0.7 | 1.2 | 0.2 |
| June | 2.4 | 3.8 | 4.8 | 3.4 | 0.7 | 1.2 | 1.2 | 1.9 | 0.4 | 0.7 | 1.2 | 0.2 |
| July | 2.3 | 3.7 | 4.7 | 3.2 | 0.7 | 1.2 | 1.3 | 1.9 | 0.5 | 0.6 | 1.1 | 0.2 |
| August | 2.3 | 3.8 | 4.6 | 2.9 | 0.7 | 1.2 | 1.3 | 1.9 | 0.5 | 0.6 | 1.1 | 0.2 |
| September | 2.4 | 3.9 | 4.8 | 3.3 | 0.8 | 1.2 | 1.4 | 1.9 | 0.5 | 0.7 | 1.2 | 0.2 |
| October | 2.4 | 3.9 | 4.8 | 2.8 | 0.8 | 1.3 | 1.5 | 2.0 | 0.6 | 0.8 | 1.2 | 0.3 |
| November | 2.4 | 4.1 | 4.9 | 3.0 | 0.8 | 1.2 | 1.5 | 2.0 | 0.6 | 0.7 | 1.3 | 0.3 |
| December | 2.7 | 4.2 | 4.9 | 2.8 | 0.8 | 1.1 | 1.4 | 2.0 | 0.6 | 0.7 | 1.3 | 0.3 |
| 2014 | ||||||||||||
| January | 2.9 | 4.0 | 4.9 | 2.7 | 0.8 | 1.1 | 1.1 | 2.0 | 0.5 | 0.7 | 1.4 | 0.1 |
| February | 2.8 | 4.0 | 4.7 | 2.6 | 0.8 | 1.1 | 1.2 | 1.9 | 0.5 | 0.7 | 1.4 | 0.5 |
| March | 2.8 | 3.9 | 4.7 | 2.4 | 0.8 | 1.1 | 1.1 | 1.9 | 0.5 | 0.6 | 1.4 | 0.5 |
| April | 2.6 | 3.9 | 4.6 | 1.5 | 0.8 | 1.0 | 1.0 | 1.8 | 0.5 | 0.5 | 1.4 | 0.5 |
| May | 2.5 | 3.7 | 4.5 | 1.3 | 0.8 | 1.0 | 1.1 | 1.8 | 0.5 | 0.6 | 1.3 | 0.5 |
| June | 2.7 | 3.7 | 4.6 | 1.2 | 0.8 | 1.0 | 1.1 | 1.8 | 0.6 | 0.6 | 1.3 | 0.6 |
| July | 2.5 | 3.9 | 4.6 | 1.8 | 0.8 | 1.1 | 1.0 | 1.7 | 0.6 | 0.7 | 1.3 | 0.7 |
| August | 2.5 | 3.9 | 4.7 | 2.4 | 0.8 | 1.1 | 0.9 | 1.8 | 0.6 | 0.7 | 1.3 | 0.4 |
| September | 2.6 | 3.9 | 4.7 | 2.9 | 0.8 | 1.1 | 0.8 | 1.9 | 0.7 | 0.7 | 1.3 | 0.4 |
| October | 2.6 | 4.0 | 4.9 | 3.1 | 0.8 | 1.1 | 0.6 | 1.9 | 0.6 | 0.7 | 1.4 | 0.3 |
| November | 2.8 | 4.1 | 5.1 | 2.9 | 0.8 | 1.1 | 0.4 | 2.0 | 0.6 | 0.7 | 1.5 | 0.3 |
| December | 2.7 | 4.0 | 5.1 | 3.2 | 0.8 | 1.1 | 0.4 | 1.9 | 0.5 | 0.6 | 1.5 | 0.2 |
| 2015 | ||||||||||||
| January | 2.6 | 4.0 | 5.1 | 3.1 | 0.9 | 1.1 | 0.5 | 1.9 | 0.5 | 0.6 | 1.4 | 0.3 |
| February | 2.6 | 4.2 | 5.2 | 2.9 | 0.8 | 1.1 | 0.7 | 2.0 | 0.5 | 0.7 | 1.4 | 0.4 |
| March | 2.6 | 4.0 | 5.0 | 3.6 | 0.8 | 1.1 | 0.8 | 2.0 | 0.5 | 0.7 | 1.4 | 0.6 |
| April | 2.6 | 3.9 | 4.9 | 4.1 | 0.7 | 1.2 | 0.8 | 2.0 | 0.5 | 0.7 | 1.3 | 0.6 |
| May | 2.6 | 3.8 | 4.7 | 4.7 | 0.7 | 1.2 | 1.0 | 1.9 | 0.5 | 0.7 | 1.2 | 0.6 |
| June | 2.4 | 3.8 | 4.6 | 4.4 | 0.7 | 1.2 | 1.1 | 1.8 | 0.5 | 0.7 | 1.2 | 0.7 |
| July | 2.3 | 3.7 | 4.5 | 4.0 | 0.7 | 1.2 | 0.8 | 1.8 | 0.5 | 0.7 | 1.1 | 0.6 |
| August | 2.2 | 3.5 | 4.4 | 4.0 | 0.7 | 1.0 | 0.6 | 1.7 | 0.5 | 0.7 | 1.1 | 0.5 |
| September | 2.1 | 3.6 | 4.6 | 3.0 | 0.8 | 1.1 | 0.7 | 1.6 | 0.5 | 0.7 | 1.1 | 0.3 |
| October | 2.1 | 3.5 | 4.7 | 2.6 | 0.8 | 1.0 | 0.7 | 1.6 | 0.5 | 0.7 | 1.1 | 0.3 |
| November | 2.1 | 3.5 | 4.6 | 2.6 | 0.8 | 1.1 | 0.7 | 1.7 | 0.5 | 0.8 | 1.1 | 0.7 |
| December | 2.3 | 3.7 | 4.4 | 2.2 | 0.7 | 1.1 | 0.5 | 1.7 | 0.5 | 0.8 | 1.0 | 0.7 |
| 2016 | ||||||||||||
| January | 2.3 | 3.7 | 4.5 | 2.3 | 0.7 | 1.1 | 0.6 | 1.7 | 0.5 | 0.7 | 1.0 | 0.7 |
| February | 2.4 | 3.8 | 4.6 | 2.3 | 0.7 | 1.2 | 0.7 | 1.7 | 0.5 | 0.8 | 1.1 | 0.7 |
| March | 2.5 | 4.0 | 4.6 | 2.3 | 0.8 | 1.2 | 0.7 | 1.7 | 0.5 | 0.8 | 1.1 | 1.0 |
| April | 2.5 | 4.0 | 4.4 | 2.3 | 0.7 | 1.2 | 0.7 | 1.7 | 0.4 | 0.8 | 1.1 | 1.0 |
| May | 2.5 | 4.0 | 4.5 | 2.1 | 0.7 | 1.1 | 0.6 | 1.6 | 0.4 | 0.8 | 1.2 | 0.6 |
| June | 2.4 | 4.0 | 4.6 | 2.7 | 0.7 | 1.1 | 0.6 | 1.6 | 0.3 | 0.8 | 1.2 | 0.6 |
| July | 2.5 | 3.9 | 4.5 | 2.9 | 0.7 | 1.0 | 0.6 | 1.6 | 0.3 | 0.9 | 1.2 | 0.8 |
| August | 2.4 | 3.9 | 4.5 | 2.8 | 0.7 | 1.1 | 0.9 | 1.7 | 0.3 | 0.9 | 1.1 | 1.0 |
| September | 2.4 | 3.9 | 4.4 | 3.0 | 0.7 | 1.1 | 0.9 | 1.7 | 0.3 | 0.8 | 1.1 | 0.7 |
| October | 2.4 | 3.9 | 4.4 | 2.9 | 0.8 | 1.1 | 0.9 | 1.7 | 0.4 | 0.7 | 1.1 | 0.6 |
| November | 2.3 | 3.8 | 4.3 | 3.1 | 0.8 | 1.1 | 0.9 | 1.6 | 0.5 | 0.7 | 1.0 | 0.5 |
| December | 2.3 | 3.8 | 4.3 | 2.5 | 0.7 | 1.2 | 0.8 | 1.7 | 0.6 | 0.6 | 1.0 | 0.5 |
| 2017 | ||||||||||||
| January | 2.2 | 3.9 | 4.3 | 2.7 | 0.8 | 1.2 | 0.8 | 1.7 | 0.6 | 0.6 | 1.2 | 0.3 |
| February | 2.3 | 3.9 | 4.2 | 3.3 | 0.7 | 1.2 | 0.5 | 1.7 | 0.6 | 0.6 | 1.1 | 0.0 |
| March | 2.5 | 3.9 | 4.3 | 3.3 | 0.7 | 1.2 | 0.5 | 1.6 | 0.6 | 0.6 | 1.1 | 0.1 |
| April | 2.3 | 3.8 | 4.3 | 3.3 | 0.7 | 1.2 | 0.7 | 1.7 | 0.5 | 0.7 | 1.2 | 0.1 |
| May | 2.4 | 3.9 | 4.4 | 3.5 | 0.7 | 1.2 | 0.9 | 1.8 | 0.5 | 0.7 | 1.2 | 0.1 |
| June | 2.6 | 3.8 | 4.4 | 3.9 | 0.8 | 1.1 | 0.9 | 1.8 | 0.5 | 0.7 | 1.2 | 0.1 |
| July | 2.7 | 3.7 | 4.4 | 3.7 | 0.7 | 1.1 | 0.9 | 1.8 | 0.5 | 0.7 | 1.1 | 0.3 |
| August | 2.8 | 3.8 | 4.4 | 3.5 | 0.7 | 1.1 | 1.0 | 1.7 | 0.5 | 0.8 | 1.2 | 0.3 |
| September | 2.8 | 3.8 | 4.4 | 3.6 | 0.7 | 1.1 | 1.0 | 1.8 | 0.5 | 0.7 | 1.2 | 0.3 |
| October | 2.9 | 3.7 | 4.5 | 3.7 | 0.7 | 1.1 | 0.9 | 1.8 | 0.4 | 0.7 | 1.1 | 0.3 |
| November | 3.0 | 3.7 | 4.6 | 3.5 | 0.8 | 1.1 | 0.7 | 1.7 | 0.5 | 0.7 | 1.1 | 0.3 |
| December | 2.9 | 3.6 | 4.6 | 3.5 | 0.8 | 1.0 | 0.7 | 1.6 | 0.4 | 0.7 | 1.1 | 0.3 |
| 2018 | ||||||||||||
| January | 3.0 | 3.6 | 4.6 | 3.6 | 0.8 | 1.0 | 0.6 | 1.6 | 0.5 | 0.7 | 1.1 | 0.3 |
| February | 2.8 | 3.4 | 4.6 | 3.2 | 0.8 | 1.0 | 0.5 | 1.6 | 0.5 | 0.8 | 1.1 | 0.3 |
| March | 2.7 | 3.4 | 4.6 | 3.1 | 0.9 | 1.0 | 0.5 | 1.6 | 0.5 | 0.8 | 1.1 | 0.2 |
| April | 2.7 | 3.5 | 4.5 | 2.8 | 0.9 | 1.1 | 0.6 | 1.7 | 0.5 | 0.7 | 1.1 | 0.3 |
| May | 2.6 | 3.5 | 4.4 | 2.8 | 0.9 | 1.1 | 0.6 | 1.8 | 0.5 | 0.7 | 1.1 | 0.3 |
| June | 2.8 | 3.6 | 4.4 | 2.7 | 0.9 | 1.2 | 0.7 | 1.8 | 0.5 | 0.7 | 1.1 | 0.3 |
| July | 2.7 | 3.8 | 4.3 | 3.8 | 0.9 | 1.3 | 0.8 | 1.8 | 0.5 | 0.7 | 1.1 | 0.2 |
| August | 2.8 | 3.8 | 4.5 | 4.2 | 0.9 | 1.3 | 0.9 | 1.9 | 0.5 | 0.7 | 1.1 | 0.2 |
| September | 2.8 | 3.8 | 4.6 | 4.1 | 0.9 | 1.3 | 0.8 | 1.9 | 0.5 | 0.8 | 1.2 | 0.3 |
| October | 2.8 | 3.7 | 4.5 | 4.9 | 0.9 | 1.2 | 0.8 | 1.8 | 0.5 | 0.8 | 1.2 | 0.3 |
| November | 2.7 | 3.6 | 4.3 | 4.3 | 0.8 | 1.2 | 0.9 | 1.8 | 0.5 | 0.8 | 1.2 | 0.2 |
| December | 2.5 | 3.6 | 4.2 | 4.1 | 0.9 | 1.2 | 0.8 | 1.7 | 0.5 | 0.8 | 1.2 | 0.1 |
| 2019 | ||||||||||||
| January | 2.6 | 3.4 | 4.2 | 2.6 | 0.8 | 1.2 | 1.2 | 1.7 | 0.5 | 0.8 | 1.2 | 0.4 |
| February | 2.6 | 3.3 | 4.2 | 1.7 | 0.8 | 1.2 | 1.1 | 1.7 | 0.4 | 0.7 | 1.2 | 0.5 |
| March | 2.4 | 3.3 | 4.0 | 1.9 | 0.7 | 1.2 | 1.1 | 1.6 | 0.5 | 0.7 | 1.1 | 0.3 |
| April | 2.4 | 3.2 | 4.1 | 1.8 | 0.7 | 1.2 | 1.3 | 1.6 | 0.5 | 0.7 | 1.1 | 0.5 |
| May | 2.6 | 3.2 | 4.1 | 2.0 | 0.7 | 1.2 | 1.3 | 1.6 | 0.5 | 0.7 | 1.1 | 0.7 |
| June | 2.8 | 3.2 | 4.3 | 2.4 | 0.7 | 1.2 | 1.2 | 1.6 | 0.5 | 0.7 | 1.1 | 0.7 |
| July | 2.7 | 3.2 | 4.4 | 2.4 | 0.7 | 1.2 | 1.0 | 1.6 | 0.6 | 0.8 | 1.1 | 0.4 |
| August | 2.7 | 3.3 | 4.3 | 2.3 | 0.6 | 1.2 | 1.1 | 1.6 | 0.5 | 0.8 | 1.1 | 0.4 |
| September | 2.7 | 3.4 | 4.4 | 2.3 | 0.7 | 1.2 | 1.1 | 1.7 | 0.5 | 0.8 | 1.1 | 0.4 |
| October | 2.7 | 3.4 | 4.4 | 2.0 | 0.6 | 1.2 | 1.0 | 1.7 | 0.5 | 0.8 | 1.1 | 0.2 |
| November | 2.7 | 3.7 | 4.5 | 2.7 | 0.7 | 1.2 | 1.1 | 1.8 | 0.5 | 0.8 | 1.3 | 0.0 |
| December | 2.7 | 3.7 | 4.5 | 2.6 | 0.7 | 1.2 | 1.2 | 1.9 | 0.4 | 0.8 | 1.3 | 0.2 |
| 2020 | ||||||||||||
| January | 2.8 | 3.7 | 4.4 | 2.6 | 0.8 | 1.2 | 1.1 | 1.9 | 0.4 | 0.8 | 1.3 | 0.5 |
| February | 2.7 | 3.7 | 4.3 | 2.9 | 0.8 | 1.2 | 1.2 | 1.9 | 0.5 | 0.8 | 1.2 | 0.7 |
| March | 2.6 | 3.5 | 4.2 | 2.8 | 0.7 | 1.2 | 1.4 | 1.8 | 0.5 | 0.8 | 1.1 | 0.8 |
| April | 2.5 | 3.3 | 4.1 | 2.5 | 0.7 | 1.1 | 1.2 | 1.6 | 0.4 | 0.7 | 1.0 | 0.7 |
| May | 2.2 | 2.9 | 3.7 | 2.0 | 0.5 | 1.0 | 1.1 | 1.4 | 0.4 | 0.6 | 0.9 | 0.7 |
| June | 1.9 | 2.8 | 3.7 | 2.0 | 0.5 | 0.9 | 0.9 | 1.4 | 0.4 | 0.5 | 0.8 | 0.6 |
| July | 1.7 | 2.7 | 3.6 | 1.8 | 0.5 | 0.9 | 0.9 | 1.4 | 0.4 | 0.5 | 0.8 | 0.2 |
| August | 1.6 | 2.7 | 3.6 | 1.5 | 0.5 | 0.8 | 0.7 | 1.4 | 0.4 | 0.5 | 0.8 | 0.1 |
| September | 1.7 | 2.8 | 3.6 | 1.8 | 0.5 | 0.8 | 0.5 | 1.5 | 0.3 | 0.6 | 0.8 | 0.2 |
| October | 2.1 | 3.2 | 4.0 | 2.4 | 0.6 | 0.9 | 0.6 | 1.8 | 0.4 | 0.6 | 0.9 | 0.2 |
| November | 2.2 | 3.4 | 4.0 | 2.0 | 0.7 | 0.9 | 0.6 | 1.8 | 0.4 | 0.7 | 0.9 | 0.2 |
| December | 2.4 | 3.2 | 4.1 | 2.7 | 0.7 | 0.9 | 0.6 | 1.7 | 0.5 | 0.6 | 0.9 | 0.2 |
| 2021 | ||||||||||||
| January | 2.4 | 3.4 | 4.2 | 3.3 | 0.7 | 0.9 | 0.6 | 1.6 | 0.4 | 0.7 | 0.9 | 0.2 |
| February | 2.4 | 3.6 | 4.3 | 3.8 | 0.7 | 0.9 | 0.7 | 1.5 | 0.5 | 0.7 | 0.9 | 0.1 |
| March | 2.5 | 3.6 | 4.4 | 4.0 | 0.7 | 1.0 | 0.7 | 1.5 | 0.5 | 0.7 | 0.9 | 0.0 |
| April | 2.2 | 3.5 | 4.2 | 3.6 | 0.7 | 1.0 | 0.9 | 1.4 | 0.5 | 0.6 | 0.9 | 0.0 |
| May | 2.4 | 3.4 | 4.2 | 4.0 | 0.7 | 1.0 | 1.0 | 1.4 | 0.5 | 0.7 | 0.9 | 0.2 |
| June | 2.4 | 3.6 | 4.3 | 4.0 | 0.7 | 1.1 | 1.4 | 1.4 | 0.5 | 0.7 | 0.8 | 0.4 |
| July | 2.5 | 3.6 | 4.2 | 3.8 | 0.7 | 1.1 | 1.6 | 1.5 | 0.5 | 0.7 | 0.9 | 0.5 |
| August | 2.6 | 3.7 | 4.4 | 4.3 | 0.7 | 1.2 | 1.7 | 1.5 | 0.5 | 0.8 | 0.9 | 0.5 |
| September | 2.7 | 3.6 | 4.4 | 4.3 | 0.7 | 1.1 | 1.9 | 1.6 | 0.5 | 0.8 | 0.9 | 0.6 |
| October | 2.8 | 3.8 | 4.6 | 5.2 | 0.8 | 1.2 | 1.7 | 1.7 | 0.5 | 0.8 | 1.0 | 0.6 |
| November | 3.0 | 3.9 | 4.8 | 5.8 | 0.8 | 1.3 | 1.6 | 1.8 | 0.5 | 0.8 | 1.1 | 0.5 |
| December | 3.0 | 3.9 | 4.5 | 5.4 | 0.8 | 1.3 | 1.4 | 1.8 | 0.5 | 0.8 | 1.1 | 0.3 |
| 2022 | ||||||||||||
| January | 3.0 | 3.9 | 4.5 | 5.5 | 0.8 | 1.3 | 1.4 | 1.8 | 0.5 | 0.8 | 1.2 | 0.3 |
| February | 3.0 | 3.8 | 4.3 | 5.3 | 0.8 | 1.4 | 1.2 | 1.8 | 0.4 | 0.7 | 1.2 | 0.3 |
| March | 2.9 | 3.9 | 4.3 | 4.5 | 0.8 | 1.3 | 1.0 | 1.8 | 0.5 | 0.7 | 1.2 | 0.3 |
| April | 2.8 | 3.8 | 4.0 | 3.9 | 0.8 | 1.3 | 0.9 | 1.7 | 0.5 | 0.7 | 1.2 | 0.5 |
| May | 2.7 | 3.9 | 3.9 | 3.3 | 0.8 | 1.3 | 1.1 | 1.6 | 0.5 | 0.7 | 1.1 | 0.4 |
| June | 2.7 | 3.8 | 4.1 | 3.0 | 0.8 | 1.2 | 1.1 | 1.6 | 0.5 | 0.7 | 1.2 | 0.5 |
| July | 2.8 | 3.8 | 4.2 | 2.7 | 0.8 | 1.4 | 1.0 | 1.6 | 0.5 | 0.7 | 1.2 | 0.5 |
| August | 2.7 | 3.7 | 4.1 | 2.4 | 0.8 | 1.3 | 1.1 | 1.5 | 0.5 | 0.7 | 1.2 | 0.5 |
| September | 2.8 | 3.5 | 4.1 | 2.5 | 0.7 | 1.3 | 0.9 | 1.4 | 0.5 | 0.7 | 1.2 | 0.6 |
| October | 2.9 | 3.5 | 4.1 | 2.5 | 0.7 | 1.3 | 1.0 | 1.4 | 0.5 | 0.7 | 1.1 | 0.4 |
| November | 2.9 | 3.2 | 4.0 | 2.5 | 0.7 | 1.2 | 0.7 | 1.4 | 0.5 | 0.7 | 1.1 | 0.4 |
| December | 2.6 | 3.1 | 3.9 | 3.0 | 0.7 | 1.1 | 0.6 | 1.4 | 0.4 | 0.8 | 1.1 | 0.4 |
| 2023 | ||||||||||||
| January | 2.5 | 3.0 | 3.8 | 3.1 | 0.7 | 1.0 | 0.7 | 1.4 | 0.4 | 0.8 | 1.0 | 0.8 |
| February | 2.5 | 3.0 | 3.8 | 2.8 | 0.7 | 1.0 | 0.6 | 1.5 | 0.4 | 0.8 | 1.0 | 0.7 |
| March | 2.4 | 3.0 | 3.8 | 2.9 | 0.7 | 1.0 | 0.7 | 1.5 | 0.4 | 0.8 | 0.9 | 0.6 |
| April | 2.4 | 3.1 | 3.7 | 2.7 | 0.7 | 0.9 | 0.8 | 1.4 | 0.4 | 0.8 | 0.9 | 0.5 |
| May | 2.4 | 3.0 | 3.8 | 2.7 | 0.7 | 1.0 | 1.0 | 1.4 | 0.4 | 0.7 | 1.0 | 0.5 |
| June | 2.5 | 3.0 | 3.8 | 1.9 | 0.7 | 1.0 | 1.0 | 1.4 | 0.4 | 0.6 | 0.9 | 0.5 |
| July | 2.5 | 2.9 | 3.6 | 2.0 | 0.6 | 0.9 | 0.8 | 1.4 | 0.4 | 0.6 | 0.9 | 0.1 |
| August | 2.4 | 2.8 | 3.5 | 1.9 | 0.7 | 0.9 | 0.7 | 1.4 | 0.4 | 0.6 | 0.9 | 0.2 |
| September | 2.5 | 2.8 | 3.4 | 1.5 | 0.6 | 0.9 | 0.7 | 1.4 | 0.4 | 0.6 | 0.9 | 0.2 |
| October | 2.3 | 2.5 | 3.2 | 2.3 | 0.7 | 0.9 | 0.6 | 1.3 | 0.4 | 0.5 | 0.8 | 0.2 |
| November | 2.1 | 2.6 | 3.1 | 2.0 | 0.6 | 0.9 | 0.4 | 1.3 | 0.5 | 0.5 | 0.8 | 0.1 |
| December | 2.3 | 2.6 | 3.0 | 2.0 | 0.6 | 0.9 | 0.4 | 1.2 | 0.5 | 0.5 | 0.8 | 0.1 |
| 2024 | ||||||||||||
| January | 2.3 | 2.6 | 2.9 | 1.7 | 0.7 | 1.0 | 0.7 | 1.2 | 0.5 | 0.5 | 0.8 | 0.2 |
| February | 2.3 | 2.6 | 2.9 | 1.7 | 0.7 | 1.0 | 0.8 | 1.1 | 0.5 | 0.5 | 0.8 | 0.1 |
| March | 2.2 | 2.7 | 2.8 | 2.0 | 0.7 | 1.0 | 0.8 | 1.1 | 0.5 | 0.5 | 0.8 | 0.1 |
| April | 2.2 | 2.8 | 2.9 | 1.6 | 0.7 | 1.0 | 0.8 | 1.2 | 0.5 | 0.5 | 0.8 | 0.1 |
| May | 2.4 | 2.8 | 2.9 | 1.8 | 0.7 | 1.0 | 1.0 | 1.2 | 0.4 | 0.5 | 0.8 | 0.2 |
| June | 2.2 | 2.9 | 2.9 | 2.1 | 0.7 | 1.0 | 1.0 | 1.3 | 0.4 | 0.6 | 0.8 | 0.2 |
| July | 2.2 | 3.0 | 3.0 | 2.1 | 0.8 | 1.0 | 0.8 | 1.3 | 0.4 | 0.6 | 0.8 | 0.2 |
| August | 2.2 | 3.1 | 3.1 | 2.3 | 0.8 | 1.0 | 0.8 | 1.3 | 0.4 | 0.5 | 0.9 | 0.2 |
| September | 2.2 | 3.1 | 3.2 | 2.3 | 0.8 | 1.0 | 0.9 | 1.3 | 0.4 | 0.6 | 0.9 | 0.2 |
| October | 2.3 | 3.1 | 3.3 | 1.9 | 0.8 | 1.0 | 0.8 | 1.2 | 0.4 | 0.6 | 0.9 | 0.2 |
| November | 2.3 | 3.2 | 3.4 | 2.5 | 0.8 | 1.0 | 0.6 | 1.3 | 0.4 | 0.6 | 0.9 | 0.1 |
| December | 2.4 | 3.2 | 3.5 | 2.4 | 0.7 | 1.0 | 0.7 | 1.4 | 0.4 | 0.6 | 0.9 | 0.1 |
| 2025 | ||||||||||||
| January | 2.4 | 3.0 | 3.5 | 2.4 | 0.6 | 1.0 | 0.7 | 1.4 | 0.4 | 0.5 | 0.9 | 0.1 |
| February | 2.5 | 3.0 | 3.5 | 2.5 | 0.6 | 1.0 | 0.7 | 1.3 | 0.4 | 0.6 | 0.8 | 0.1 |
| March | 2.5 | 2.9 | 3.2 | 2.2 | 0.5 | 0.9 | 0.5 | 1.4 | 0.4 | 0.5 | 0.8 | 0.1 |
| April | 2.4 | 2.9 | 3.3 | 2.9 | 0.6 | 0.9 | 0.6 | 1.4 | 0.4 | 0.6 | 0.9 | 0.2 |
| May | 2.3 | 2.8 | 3.2 | 2.0 | 0.5 | 0.9 | 0.6 | 1.3 | 0.4 | 0.6 | 0.8 | 0.2 |
| June | 2.2 | 2.8 | 3.2 | 1.8 | 0.6 | 0.9 | 0.7 | 1.3 | 0.4 | 0.6 | 0.9 | 0.2 |
| July | 2.2 | 2.7 | 3.1 | 1.6 | 0.6 | 1.0 | 0.7 | 1.3 | 0.4 | 0.6 | 0.8 | 0.1 |
| August | 2.4 | 2.8 | 3.1 | 1.5 | 0.6 | 0.9 | 0.6 | 1.4 | 0.4 | 0.5 | 0.8 | 0.1 |
| September | 2.4 | 2.9 | 3.3 | 2.0 | 0.6 | 0.9 | 0.6 | 1.3 | 0.4 | 0.5 | 0.8 | 0.1 |
| October | 2.5 | 2.8 | 3.3 | 1.6 | 0.6 | 0.9 | 0.5 | 1.3 | 0.4 | 0.4 | 0.8 | 0.0 |
| November | 2.4 | 2.8 | 3.5 | 1.7 | 0.6 | 0.9 | 0.6 | 1.3 | 0.3 | 0.4 | 0.8 | 0.1 |
| December | 2.4 | 2.9 | 3.3 | 1.7 | 0.7 | 0.8 | 0.5 | 1.3 | 0.3 | 0.4 | 0.8 | 0.1 |
| 2026 | ||||||||||||
| January | 2.6 | 3.0 | 3.4 | 1.7 | 0.7 | 0.8 | 0.5 | 1.3 | 0.3 | 0.5 | 0.8 | 0.1 |
| February | 2.4 | 3.2 | 3.6 | 1.9 | 0.7 | 0.9 | 0.6 | 1.3 | 0.3 | 0.5 | 0.8 | 0.3 |
| March | 2.3 | 3.2 | 3.6 | 1.5 | 0.7 | 0.9 | 0.6 | 1.3 | 0.3 | 0.6 | 0.8 | 0.3 |
| April | 2.4 | 3.3 | 3.6 | 1.7 | 0.7 | 0.9 | 0.6 | 1.3 | 0.4 | 0.6 | 0.8 | 0.3 |
| May | 2.6 | 3.5 | 3.4 | 1.8 | 0.7 | 0.9 | 0.5 | 1.3 | 0.4 | 0.6 | 0.8 | 0.3 |
| June | 2.8 | 3.5 | 3.5 | 2.0 | 0.7 | 0.9 | 0.6 | 1.2 | 0.4 | 0.6 | 0.8 | 0.3 |
| July | 2.7 | 3.4 | 3.4 | 2.0 | 0.7 | 0.9 | 0.6 | 1.2 | 0.4 | 0.6 | 0.8 | 0.2 |
| August | 2.5 | 3.0 | 3.3 | 1.9 | 0.6 | 0.9 | 0.5 | 1.2 | 0.5 | 0.6 | 0.8 | 0.1 |
Thus, it is unclear whether lower hiring rates reflect advances in disruptive technologies or the cumulative effects of competing economic forces—e.g., rapid population shifts, trade shocks, and labour market adjustments following an expansionary period as the job market recovered after the COVID-19 pandemic. Hiring rates generally began decreasing before the mass availability of ChatGPT in November 2022, regardless of potential AI exposure. Moreover, in areas where AI is expected to have a larger impact, changes arrived before the widespread recognition of the capabilities of large language models. For example, the hiring rate for workers aged 15 to 29 in coding-intensive occupations started decreasing in early 2022, after reaching a 15-year high of 5.8% in the six months leading up to November 2021.
Hiring rates for employees aged 30 to 49 and 50 to 64 were lower and more stable than for the 15-to-29 age group. Hiring rates (and job separation rates) are usually higher for younger workers because, among other factors, they are more likely to enter the workforce for the first time and be in high-turnover jobs, and they may be more amenable to changing jobs or leaving jobs (because they may have fewer family commitments or for other reasons).
Job separation rates have generally remained stable over the past five years regardless of potential occupational exposure to artificial intelligence
The job separation rate for employees aged 15 to 29 in HEHC jobs remained at around 2.2% from the six months leading up to November 2022 to the six months leading up to August 2026. This is very similar to the rates observed over at least the last two decades (Chart 2). Over the same period, this rate for HELC jobs averaged roughly 2.9% which is well within the historical range for HELC jobs. Job separation rates in LE jobs have generally stabilized around 3.2% over the same period. Job separation rates in coding-intensive occupations increased from 2.4% to 3.5% but the trend was more volatile possibly because of a relatively small sample. Job separation rates for employees aged 30 to 49 and 50 to 64 generally mirrored the trends observed for those aged 15 to 29, but the rates were lower in magnitude.
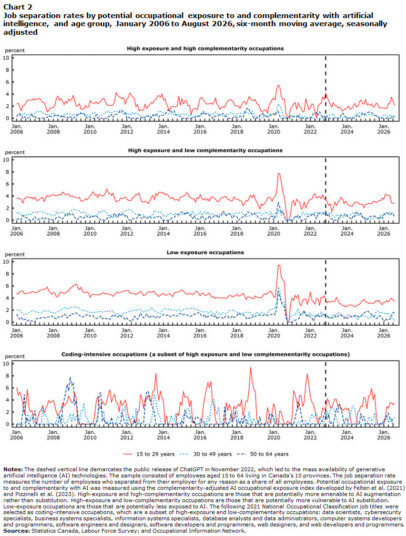
Data table for Chart 2
| 15 to 29 years | 30 to 49 years | 50 to 64 years | ||||||||||
|---|---|---|---|---|---|---|---|---|---|---|---|---|
| High-exposure and high-complementarity occupations | High-exposure and low-complementarity occupations | Low-exposure occupations | Coding-intensive occupations (a subset of high-exposure and low-complementarity occupations) | High-exposure and high-complementarity occupations | High-exposure and low-complementarity occupations | Low-exposure occupations | Coding-intensive occupations (a subset of high-exposure and low-complementarity occupations) | High-exposure and high-complementarity occupations | High-exposure and low-complementarity occupations | Low-exposure occupations | Coding-intensive occupations (a subset of high-exposure and low-complementarity occupations) | |
| percent | ||||||||||||
| Notes: The dashed vertical line demarcates the public release of ChatGPT in November 2022, which led to the mass availability of generative artificial intelligence (AI) technologies. The sample consisted of employees aged 15 to 64 living in Canada’s 10 provinces. The job separation rate measures the number of employees who separated from their employer for any reason as a share of all employees. Potential occupational exposure to and complementarity with AI was measured using the complementarity-adjusted AI occupational exposure index developed by Felten et al. (2021) and Pizzinelli et al. (2023). High-exposure and high-complementarity occupations are those that are potentially more amenable to AI augmentation rather than substitution. High-exposure and low-complementarity occupations are those that are potentially more vulnerable to AI substitution. Low-exposure occupations are those that are potentially less exposed to AI. The following 2021 National Occupational Classification job titles were selected as coding-intensive occupations, which are a subset of high-exposure and low-complementarity occupations: data scientists, cybersecurity specialists, business systems specialists, information systems specialists, database analysts and data administrators, computer systems developers and programmers, software engineers and designers, software developers and programmers, web designers, and web developers and programmers. Sources: Statistics Canada, Labour Force Survey; and Occupational Information Network. |
||||||||||||
| 2006 | ||||||||||||
| January | 2.4 | 3.6 | 4.8 | 6.1 | 0.4 | 1.2 | 2.0 | 0.0 | 0.3 | 0.1 | 1.3 | 0.0 |
| February | 2.5 | 3.7 | 4.6 | 4.8 | 0.5 | 1.3 | 2.0 | 0.1 | 0.6 | 0.2 | 0.8 | 0.0 |
| March | 1.9 | 3.5 | 5.0 | 5.3 | 0.5 | 1.0 | 2.0 | 0.0 | 0.8 | 0.1 | 0.5 | 0.0 |
| April | 1.2 | 3.4 | 5.1 | 4.6 | 0.6 | 0.9 | 1.7 | 0.0 | 0.4 | 0.1 | 0.8 | 0.0 |
| May | 2.1 | 2.9 | 5.2 | 3.5 | 0.6 | 0.8 | 1.5 | 0.0 | 0.0 | 0.8 | 0.4 | 1.9 |
| June | 2.1 | 3.6 | 4.7 | 1.7 | 0.8 | 0.8 | 1.3 | 0.0 | 0.3 | 0.6 | 0.5 | 4.9 |
| July | 2.6 | 3.7 | 4.7 | 3.3 | 0.7 | 0.7 | 1.3 | 0.3 | 0.0 | 0.4 | 0.5 | 0.2 |
| August | 3.0 | 3.8 | 4.8 | 5.7 | 0.4 | 1.1 | 1.4 | 1.6 | 0.0 | 0.4 | 0.2 | 1.0 |
| September | 3.0 | 3.8 | 4.9 | 2.7 | 0.6 | 0.9 | 1.6 | 1.3 | 0.1 | 0.0 | 0.4 | 0.0 |
| October | 3.0 | 3.7 | 4.8 | 2.1 | 0.8 | 0.9 | 1.7 | 1.0 | 0.3 | 0.0 | 0.2 | 0.8 |
| November | 3.0 | 3.8 | 5.1 | 2.3 | 0.7 | 1.2 | 2.0 | 1.5 | 0.7 | 0.0 | 0.2 | 0.8 |
| December | 3.3 | 3.5 | 5.1 | 1.0 | 0.7 | 1.3 | 1.9 | 0.0 | 0.1 | 0.2 | 0.2 | 1.2 |
| 2007 | ||||||||||||
| January | 3.0 | 3.8 | 4.9 | 0.3 | 0.8 | 1.4 | 1.8 | 0.0 | 0.3 | 0.6 | 0.0 | 2.3 |
| February | 3.2 | 3.3 | 4.9 | 0.0 | 1.1 | 1.2 | 1.7 | 0.0 | 0.0 | 0.2 | 0.6 | 0.0 |
| March | 3.2 | 3.2 | 5.0 | 1.3 | 1.0 | 1.3 | 1.6 | 0.0 | 0.0 | 0.1 | 0.7 | 0.0 |
| April | 3.3 | 3.5 | 5.3 | 2.1 | 1.2 | 1.5 | 1.5 | 0.0 | 0.0 | 0.3 | 0.6 | 0.0 |
| May | 3.0 | 3.7 | 5.3 | 2.3 | 1.1 | 1.4 | 1.5 | 0.0 | 0.0 | 0.3 | 0.8 | 0.0 |
| June | 2.6 | 3.8 | 5.3 | 3.1 | 0.9 | 1.3 | 1.8 | 2.7 | 0.0 | 0.4 | 0.8 | 0.0 |
| July | 2.6 | 3.1 | 5.5 | 1.9 | 0.8 | 1.2 | 1.9 | 1.3 | 0.0 | 0.1 | 0.8 | 0.0 |
| August | 1.9 | 3.7 | 5.5 | 2.7 | 0.6 | 1.2 | 1.9 | 1.7 | 0.1 | 0.4 | 0.7 | 0.0 |
| September | 1.1 | 4.1 | 5.8 | 3.1 | 0.7 | 1.0 | 1.8 | 1.0 | 0.2 | 0.4 | 0.8 | 0.0 |
| October | 1.3 | 3.9 | 5.2 | 4.0 | 0.3 | 1.1 | 1.9 | 0.0 | 0.4 | 0.2 | 0.9 | 0.0 |
| November | 1.7 | 4.0 | 4.9 | 3.5 | 0.5 | 0.9 | 1.7 | 0.2 | 0.3 | 0.0 | 0.9 | 0.0 |
| December | 1.7 | 4.2 | 4.6 | 3.8 | 0.8 | 0.8 | 1.5 | 0.0 | 0.3 | 0.1 | 1.0 | 0.0 |
| 2008 | ||||||||||||
| January | 1.8 | 4.2 | 4.9 | 3.9 | 0.9 | 0.8 | 1.6 | 0.0 | 0.3 | 0.0 | 0.7 | 0.0 |
| February | 2.2 | 4.1 | 4.8 | 3.1 | 0.6 | 0.8 | 1.6 | 0.0 | 0.5 | 0.1 | 0.6 | 0.0 |
| March | 3.3 | 4.1 | 4.2 | 1.9 | 0.4 | 1.4 | 1.5 | 0.6 | 0.4 | 0.5 | 0.6 | 0.0 |
| April | 3.7 | 4.1 | 4.2 | 1.4 | 0.4 | 1.0 | 1.8 | 1.7 | 0.5 | 0.5 | 0.9 | 0.0 |
| May | 2.9 | 4.3 | 4.7 | 1.9 | 0.5 | 1.2 | 1.9 | 0.8 | 0.4 | 0.5 | 0.9 | 1.5 |
| June | 3.3 | 4.1 | 5.0 | 2.2 | 0.3 | 1.2 | 2.2 | 1.1 | 0.2 | 0.3 | 0.8 | 0.0 |
| July | 2.8 | 4.7 | 4.8 | 3.5 | 0.2 | 1.3 | 2.2 | 1.5 | 0.5 | 0.2 | 1.1 | 2.7 |
| August | 2.2 | 4.5 | 4.7 | 3.0 | 0.6 | 1.2 | 2.3 | 0.1 | 0.2 | 0.5 | 1.3 | 4.0 |
| September | 2.8 | 4.2 | 4.9 | 3.4 | 0.6 | 0.9 | 2.5 | 0.2 | 0.2 | 0.9 | 1.2 | 5.2 |
| October | 2.5 | 4.3 | 5.1 | 3.6 | 0.8 | 1.1 | 2.2 | 0.3 | 0.2 | 0.7 | 0.7 | 6.6 |
| November | 3.2 | 4.3 | 5.2 | 4.7 | 0.7 | 1.2 | 2.3 | 0.9 | 0.0 | 1.2 | 1.1 | 5.5 |
| December | 2.9 | 3.9 | 5.6 | 4.1 | 0.7 | 1.5 | 2.3 | 1.7 | 0.3 | 0.9 | 1.1 | 7.8 |
| 2009 | ||||||||||||
| January | 3.1 | 4.0 | 5.7 | 3.5 | 0.6 | 1.7 | 2.5 | 0.3 | 0.0 | 1.1 | 1.4 | 6.4 |
| February | 3.8 | 4.0 | 6.1 | 3.6 | 0.4 | 1.8 | 2.5 | 1.7 | 0.0 | 0.9 | 1.3 | 6.9 |
| March | 2.9 | 3.8 | 6.2 | 5.2 | 0.7 | 1.7 | 2.5 | 0.5 | 0.2 | 0.4 | 1.3 | 3.1 |
| April | 2.0 | 3.7 | 6.3 | 4.1 | 0.7 | 1.7 | 2.5 | 1.3 | 0.3 | 0.3 | 1.6 | 3.9 |
| May | 2.0 | 3.7 | 5.8 | 0.0 | 0.5 | 1.6 | 2.4 | 0.9 | 0.6 | 0.1 | 1.3 | 1.5 |
| June | 2.4 | 3.8 | 5.4 | 0.0 | 0.8 | 1.6 | 2.3 | 0.1 | 0.7 | 0.6 | 1.1 | 0.0 |
| July | 1.5 | 3.2 | 5.8 | 0.0 | 0.9 | 1.2 | 2.1 | 2.2 | 0.8 | 0.6 | 1.0 | 0.0 |
| August | 1.6 | 3.2 | 5.1 | 0.1 | 0.8 | 1.4 | 1.9 | 2.1 | 0.8 | 0.3 | 0.8 | 0.0 |
| September | 1.5 | 3.3 | 4.9 | 0.0 | 0.5 | 1.2 | 1.9 | 3.5 | 0.8 | 0.4 | 1.0 | 0.0 |
| October | 2.1 | 3.6 | 4.9 | 0.0 | 0.3 | 1.2 | 1.9 | 1.2 | 0.5 | 0.8 | 1.2 | 0.0 |
| November | 1.8 | 3.4 | 5.0 | 0.0 | 0.5 | 1.1 | 1.7 | 1.2 | 0.0 | 0.7 | 1.2 | 0.0 |
| December | 1.8 | 3.7 | 4.8 | 0.0 | 0.5 | 0.8 | 1.8 | 0.3 | 0.2 | 0.4 | 1.3 | 0.0 |
| 2010 | ||||||||||||
| January | 2.9 | 4.0 | 4.1 | 0.0 | 0.5 | 0.8 | 1.6 | 0.0 | 0.2 | 0.5 | 1.0 | 0.0 |
| February | 2.6 | 4.4 | 4.5 | 0.2 | 0.8 | 0.5 | 1.6 | 0.0 | 0.1 | 0.7 | 1.0 | 0.0 |
| March | 2.5 | 4.7 | 4.6 | 0.0 | 0.8 | 0.8 | 1.6 | 0.0 | 0.0 | 0.6 | 1.1 | 0.0 |
| April | 2.5 | 4.1 | 4.6 | 1.5 | 0.9 | 0.8 | 1.6 | 0.0 | 0.0 | 0.7 | 0.7 | 0.0 |
| May | 2.7 | 4.3 | 4.6 | 3.7 | 0.8 | 0.7 | 1.8 | 0.4 | 0.6 | 0.7 | 0.6 | 0.0 |
| June | 2.4 | 3.7 | 4.5 | 4.6 | 0.6 | 1.0 | 1.6 | 1.6 | 0.0 | 0.5 | 0.7 | 0.8 |
| July | 2.6 | 4.3 | 4.5 | 2.9 | 0.3 | 1.5 | 1.7 | 2.6 | 0.0 | 0.4 | 0.8 | 5.0 |
| August | 2.8 | 4.1 | 4.6 | 2.6 | 0.4 | 1.3 | 1.8 | 3.0 | 0.0 | 0.0 | 1.0 | 5.2 |
| September | 3.2 | 4.0 | 4.8 | 3.8 | 0.6 | 1.5 | 1.7 | 1.6 | 0.0 | 0.1 | 0.6 | 0.5 |
| October | 3.3 | 4.1 | 4.9 | 3.3 | 0.7 | 1.7 | 1.7 | 2.2 | 0.0 | 0.0 | 0.5 | 1.0 |
| November | 2.7 | 4.5 | 4.6 | 3.1 | 1.1 | 1.5 | 1.8 | 0.0 | 0.0 | 0.0 | 0.6 | 0.1 |
| December | 2.2 | 5.2 | 4.8 | 3.9 | 0.9 | 1.2 | 1.9 | 0.5 | 0.0 | 0.2 | 0.5 | 0.2 |
| 2011 | ||||||||||||
| January | 2.2 | 4.5 | 4.7 | 4.9 | 1.2 | 0.6 | 1.7 | 0.0 | 0.4 | 0.5 | 0.6 | 0.0 |
| February | 2.1 | 4.4 | 4.5 | 5.7 | 0.9 | 1.0 | 1.9 | 0.0 | 0.2 | 0.5 | 0.4 | 0.0 |
| March | 2.2 | 4.1 | 4.5 | 3.6 | 0.9 | 0.7 | 1.8 | 0.2 | 0.6 | 0.6 | 0.9 | 1.1 |
| April | 2.2 | 4.5 | 4.3 | 4.4 | 1.1 | 0.3 | 1.8 | 0.0 | 0.2 | 0.8 | 1.3 | 0.0 |
| May | 2.7 | 3.6 | 4.6 | 4.9 | 1.1 | 0.8 | 1.4 | 0.2 | 0.6 | 1.1 | 1.0 | 0.0 |
| June | 4.3 | 3.0 | 4.8 | 3.6 | 1.1 | 0.9 | 1.3 | 0.0 | 0.7 | 0.6 | 1.1 | 0.0 |
| July | 3.8 | 3.2 | 5.0 | 3.5 | 1.1 | 1.0 | 1.5 | 1.3 | 0.7 | 0.4 | 0.8 | 0.0 |
| August | 3.6 | 3.2 | 4.9 | 2.0 | 1.3 | 0.7 | 1.1 | 1.1 | 1.0 | 1.1 | 1.2 | 0.2 |
| September | 3.4 | 3.7 | 5.0 | 3.9 | 1.0 | 0.9 | 1.3 | 1.3 | 1.3 | 0.7 | 1.0 | 0.0 |
| October | 3.2 | 3.6 | 5.1 | 3.1 | 0.9 | 1.3 | 1.2 | 2.6 | 1.3 | 0.9 | 0.8 | 2.0 |
| November | 3.4 | 3.6 | 5.1 | 3.4 | 0.6 | 1.3 | 1.5 | 2.1 | 0.9 | 1.1 | 0.7 | 0.7 |
| December | 2.4 | 3.8 | 5.2 | 4.0 | 1.0 | 1.6 | 1.6 | 3.1 | 0.9 | 0.7 | 0.4 | 0.0 |
| 2012 | ||||||||||||
| January | 3.1 | 3.5 | 5.2 | 2.9 | 0.7 | 1.7 | 1.6 | 0.0 | 0.0 | 0.8 | 0.7 | 0.1 |
| February | 3.4 | 3.3 | 5.2 | 1.3 | 0.6 | 1.8 | 1.8 | 1.2 | 0.2 | 0.1 | 0.4 | 0.0 |
| March | 4.2 | 3.2 | 4.8 | 0.8 | 0.8 | 1.8 | 1.8 | 0.7 | 0.0 | 0.0 | 0.3 | 0.0 |
| April | 3.8 | 3.3 | 4.8 | 0.0 | 0.6 | 1.7 | 1.9 | 0.9 | 0.0 | 0.0 | 0.1 | 0.0 |
| May | 3.4 | 3.8 | 4.8 | 0.0 | 1.0 | 1.4 | 2.0 | 1.4 | 0.0 | 0.2 | 0.4 | 0.0 |
| June | 3.3 | 3.8 | 4.7 | 0.5 | 0.6 | 1.1 | 2.0 | 0.2 | 0.0 | 0.3 | 1.0 | 0.8 |
| July | 1.9 | 4.3 | 4.6 | 0.2 | 0.9 | 1.0 | 1.9 | 2.7 | 0.0 | 0.3 | 0.7 | 0.0 |
| August | 2.3 | 4.2 | 4.8 | 2.1 | 0.7 | 1.0 | 2.1 | 0.3 | 0.0 | 0.5 | 0.5 | 0.0 |
| September | 1.2 | 4.5 | 4.9 | 2.2 | 0.6 | 0.9 | 2.1 | 0.8 | 0.0 | 1.0 | 0.9 | 0.2 |
| October | 1.4 | 3.5 | 5.1 | 4.9 | 0.3 | 0.8 | 2.1 | 0.0 | 0.0 | 0.4 | 1.5 | 0.0 |
| November | 1.3 | 3.1 | 4.8 | 4.2 | 0.2 | 0.9 | 1.8 | 0.0 | 0.2 | 0.2 | 1.0 | 0.2 |
| December | 1.4 | 3.0 | 4.4 | 2.6 | 0.2 | 0.9 | 1.6 | 0.0 | 0.1 | 0.6 | 0.7 | 0.2 |
| 2013 | ||||||||||||
| January | 2.3 | 3.2 | 4.5 | 4.2 | 0.2 | 0.7 | 2.0 | 0.0 | 0.2 | 0.4 | 1.0 | 3.1 |
| February | 1.6 | 3.0 | 4.7 | 4.1 | 0.3 | 0.5 | 1.8 | 0.0 | 0.4 | 0.3 | 1.4 | 5.4 |
| March | 1.9 | 2.7 | 5.0 | 4.8 | 0.3 | 0.6 | 1.9 | 0.0 | 0.3 | 0.4 | 1.0 | 5.4 |
| April | 2.2 | 3.2 | 5.0 | 3.9 | 0.3 | 0.6 | 2.0 | 0.0 | 0.4 | 0.6 | 0.7 | 4.6 |
| May | 2.6 | 3.7 | 4.9 | 3.7 | 0.2 | 0.7 | 2.4 | 0.5 | 0.0 | 0.3 | 1.1 | 3.3 |
| June | 2.5 | 4.1 | 5.1 | 5.4 | 0.5 | 0.8 | 2.3 | 2.0 | 0.4 | 0.4 | 1.1 | 2.7 |
| July | 3.0 | 3.4 | 5.1 | 5.6 | 0.4 | 1.6 | 1.8 | 5.0 | 0.7 | 0.4 | 0.8 | 1.9 |
| August | 3.1 | 4.4 | 4.6 | 8.4 | 0.6 | 1.5 | 1.7 | 4.1 | 0.6 | 0.6 | 0.6 | 0.0 |
| September | 3.7 | 4.1 | 4.5 | 5.6 | 0.8 | 1.4 | 1.5 | 2.3 | 0.5 | 0.6 | 1.0 | 0.0 |
| October | 3.8 | 4.6 | 4.2 | 3.9 | 1.2 | 1.3 | 1.6 | 1.6 | 0.2 | 0.6 | 0.8 | 0.0 |
| November | 3.5 | 4.7 | 4.5 | 5.5 | 1.1 | 1.4 | 1.4 | 0.9 | 0.5 | 0.7 | 0.9 | 0.0 |
| December | 4.0 | 4.4 | 4.7 | 4.4 | 1.0 | 1.2 | 1.9 | 0.0 | 0.5 | 0.1 | 1.1 | 0.0 |
| 2014 | ||||||||||||
| January | 3.0 | 4.6 | 4.7 | 3.6 | 1.0 | 0.7 | 2.1 | 0.0 | 0.5 | 0.0 | 1.3 | 0.0 |
| February | 3.2 | 4.2 | 4.5 | 0.0 | 0.8 | 0.8 | 2.3 | 0.0 | 0.7 | 0.0 | 1.3 | 0.0 |
| March | 2.3 | 4.4 | 4.5 | 1.4 | 0.8 | 0.6 | 2.2 | 0.0 | 1.0 | 0.0 | 1.1 | 0.0 |
| April | 1.8 | 4.1 | 4.6 | 0.0 | 0.7 | 0.9 | 2.1 | 0.2 | 1.4 | 0.0 | 1.2 | 0.0 |
| May | 1.1 | 3.7 | 4.7 | 0.0 | 0.7 | 1.1 | 2.1 | 0.0 | 1.1 | 0.0 | 1.0 | 0.0 |
| June | 1.9 | 3.5 | 4.5 | 0.0 | 0.8 | 1.1 | 2.0 | 1.4 | 1.1 | 0.3 | 0.9 | 0.0 |
| July | 2.0 | 3.8 | 4.2 | 0.0 | 0.7 | 1.0 | 2.0 | 0.8 | 1.0 | 0.4 | 1.1 | 0.0 |
| August | 1.9 | 3.4 | 4.9 | 0.0 | 0.6 | 0.9 | 2.0 | 0.4 | 1.3 | 0.5 | 1.2 | 0.0 |
| September | 1.9 | 3.4 | 4.9 | 0.0 | 0.6 | 1.2 | 1.9 | 1.7 | 0.5 | 0.8 | 1.0 | 0.0 |
| October | 2.0 | 3.5 | 5.0 | 1.8 | 0.5 | 1.1 | 1.9 | 0.0 | 0.5 | 0.9 | 1.1 | 0.0 |
| November | 3.7 | 3.2 | 5.0 | 1.4 | 0.7 | 0.7 | 2.1 | 0.2 | 0.4 | 1.0 | 1.3 | 0.0 |
| December | 2.1 | 3.8 | 5.1 | 3.7 | 0.6 | 0.8 | 1.8 | 0.0 | 0.3 | 1.2 | 1.5 | 0.0 |
| 2015 | ||||||||||||
| January | 3.3 | 3.8 | 5.4 | 3.1 | 0.7 | 1.1 | 1.9 | 0.8 | 0.0 | 1.4 | 1.2 | 0.5 |
| February | 2.4 | 4.0 | 5.1 | 5.4 | 0.7 | 1.0 | 2.0 | 1.6 | 0.0 | 1.4 | 1.2 | 0.0 |
| March | 2.9 | 4.1 | 4.8 | 4.4 | 0.6 | 1.2 | 2.2 | 1.3 | 0.0 | 1.0 | 1.3 | 2.4 |
| April | 2.9 | 4.6 | 4.7 | 4.5 | 0.7 | 1.1 | 2.2 | 2.2 | 0.0 | 1.3 | 1.2 | 1.5 |
| May | 2.1 | 4.4 | 4.6 | 4.4 | 0.4 | 1.3 | 2.2 | 2.6 | 0.0 | 1.1 | 1.1 | 0.9 |
| June | 2.2 | 3.8 | 4.8 | 2.9 | 0.4 | 1.2 | 2.3 | 2.4 | 0.0 | 0.9 | 0.9 | 1.0 |
| July | 0.5 | 3.7 | 4.7 | 4.0 | 0.6 | 0.8 | 2.3 | 0.4 | 0.0 | 0.7 | 1.0 | 1.3 |
| August | 1.4 | 3.5 | 4.5 | 0.2 | 0.2 | 1.5 | 2.2 | 0.6 | 0.0 | 0.3 | 1.2 | 0.9 |
| September | 1.6 | 3.6 | 4.8 | 0.4 | 0.1 | 1.0 | 2.3 | 0.4 | 0.1 | 0.7 | 1.3 | 0.0 |
| October | 1.6 | 3.0 | 5.1 | 0.0 | 0.1 | 0.7 | 2.2 | 0.0 | 0.4 | 0.2 | 1.3 | 1.2 |
| November | 1.4 | 3.8 | 5.1 | 0.0 | 0.3 | 1.0 | 1.9 | 0.0 | 0.2 | 0.2 | 1.4 | 1.2 |
| December | 2.3 | 3.6 | 4.7 | 0.0 | 0.4 | 1.0 | 2.0 | 0.0 | 0.4 | 0.2 | 1.7 | 0.9 |
| 2016 | ||||||||||||
| January | 3.4 | 4.3 | 4.4 | 0.1 | 0.2 | 1.4 | 1.9 | 0.6 | 0.7 | 0.2 | 1.4 | 1.0 |
| February | 3.4 | 3.6 | 4.8 | 0.4 | 0.7 | 0.8 | 1.8 | 0.0 | 0.7 | 0.8 | 1.0 | 0.6 |
| March | 3.1 | 3.4 | 4.8 | 2.9 | 0.8 | 1.1 | 1.7 | 0.0 | 1.2 | 0.5 | 0.9 | 0.5 |
| April | 2.7 | 3.6 | 4.4 | 4.5 | 0.8 | 1.5 | 1.7 | 0.0 | 0.6 | 0.1 | 1.3 | 0.0 |
| May | 2.4 | 3.3 | 4.5 | 5.7 | 0.7 | 1.0 | 1.8 | 0.4 | 0.8 | 0.3 | 0.7 | 0.0 |
| June | 2.4 | 3.6 | 4.6 | 6.9 | 0.7 | 1.4 | 1.5 | 1.3 | 0.6 | 0.3 | 1.0 | 0.0 |
| July | 2.4 | 3.1 | 4.8 | 6.0 | 0.7 | 0.9 | 1.7 | 0.5 | 0.4 | 0.8 | 1.0 | 0.0 |
| August | 2.5 | 3.8 | 4.3 | 7.1 | 0.6 | 1.0 | 1.8 | 3.0 | 0.4 | 0.3 | 1.1 | 0.0 |
| September | 2.3 | 3.9 | 4.1 | 3.7 | 0.8 | 1.0 | 1.5 | 3.9 | 0.0 | 0.4 | 1.1 | 0.0 |
| October | 2.6 | 3.7 | 4.2 | 3.0 | 0.8 | 1.0 | 1.3 | 4.1 | 0.4 | 0.7 | 0.8 | 0.0 |
| November | 3.4 | 3.4 | 3.9 | 0.8 | 1.0 | 0.8 | 1.4 | 2.3 | 0.3 | 0.6 | 1.2 | 0.0 |
| December | 2.4 | 3.1 | 4.1 | 0.0 | 0.8 | 0.6 | 1.7 | 1.6 | 0.4 | 0.7 | 0.5 | 0.0 |
| 2017 | ||||||||||||
| January | 2.0 | 3.0 | 4.0 | 0.0 | 0.7 | 0.9 | 1.4 | 2.9 | 0.4 | 0.4 | 0.8 | 0.0 |
| February | 1.5 | 3.4 | 4.0 | 0.0 | 0.6 | 1.0 | 1.2 | 0.6 | 0.6 | 0.8 | 0.8 | 0.0 |
| March | 1.9 | 3.8 | 4.0 | 0.0 | 0.4 | 0.8 | 1.4 | 0.0 | 0.6 | 1.0 | 0.8 | 0.0 |
| April | 1.9 | 3.7 | 4.1 | 0.0 | 0.4 | 0.8 | 1.6 | 0.0 | 0.8 | 1.5 | 0.6 | 0.0 |
| May | 1.8 | 3.9 | 4.0 | 0.3 | 0.2 | 1.1 | 1.5 | 0.0 | 0.4 | 1.1 | 0.8 | 2.8 |
| June | 2.5 | 3.8 | 3.9 | 3.6 | 0.7 | 1.0 | 1.4 | 0.0 | 0.3 | 0.8 | 1.1 | 0.0 |
| July | 2.8 | 3.5 | 4.2 | 2.2 | 0.5 | 1.1 | 1.6 | 0.0 | 0.0 | 0.9 | 1.0 | 0.0 |
| August | 3.0 | 3.4 | 4.4 | 3.3 | 0.8 | 0.9 | 1.9 | 0.0 | 0.0 | 1.1 | 0.7 | 0.4 |
| September | 3.1 | 3.2 | 4.4 | 2.6 | 0.9 | 1.1 | 2.0 | 0.4 | 0.0 | 0.8 | 0.7 | 1.6 |
| October | 2.9 | 3.2 | 4.2 | 0.3 | 0.9 | 0.8 | 2.0 | 0.7 | 0.0 | 0.3 | 1.1 | 0.5 |
| November | 2.5 | 3.9 | 4.2 | 3.0 | 0.5 | 1.1 | 2.0 | 0.9 | 0.2 | 0.7 | 0.8 | 0.7 |
| December | 2.0 | 3.5 | 4.5 | 2.5 | 0.2 | 1.2 | 1.8 | 2.1 | 0.1 | 0.8 | 0.8 | 2.1 |
| 2018 | ||||||||||||
| January | 2.0 | 3.5 | 4.6 | 2.8 | 0.8 | 1.2 | 1.6 | 2.3 | 0.1 | 0.6 | 1.1 | 0.0 |
| February | 2.0 | 3.4 | 4.3 | 3.3 | 0.8 | 1.3 | 1.3 | 0.6 | 0.1 | 0.0 | 1.6 | 0.5 |
| March | 1.6 | 3.2 | 4.4 | 2.9 | 0.8 | 1.2 | 1.1 | 0.0 | 0.4 | 0.2 | 1.4 | 0.1 |
| April | 2.2 | 3.2 | 4.5 | 4.1 | 0.8 | 1.3 | 1.4 | 1.0 | 0.3 | 0.4 | 1.3 | 0.9 |
| May | 2.6 | 2.4 | 4.8 | 1.4 | 0.7 | 1.0 | 1.5 | 0.9 | 0.2 | 0.6 | 1.3 | 0.0 |
| June | 2.8 | 2.7 | 4.4 | 2.5 | 1.2 | 0.8 | 1.6 | 0.9 | 0.8 | 0.8 | 1.0 | 1.5 |
| July | 2.3 | 3.3 | 3.7 | 3.8 | 1.0 | 0.4 | 1.7 | 0.0 | 1.4 | 0.9 | 0.7 | 0.7 |
| August | 2.9 | 3.1 | 4.2 | 3.8 | 0.9 | 0.7 | 1.5 | 0.4 | 1.7 | 1.4 | 0.5 | 0.1 |
| September | 3.6 | 3.7 | 4.2 | 6.0 | 0.7 | 0.7 | 1.7 | 2.0 | 1.4 | 1.3 | 0.7 | 0.0 |
| October | 3.1 | 4.1 | 4.1 | 9.4 | 0.9 | 0.8 | 1.4 | 0.6 | 0.9 | 1.2 | 0.6 | 0.0 |
| November | 3.1 | 3.7 | 4.0 | 7.0 | 1.3 | 0.9 | 1.1 | 0.2 | 0.7 | 0.9 | 0.8 | 0.0 |
| December | 2.9 | 4.2 | 3.9 | 5.9 | 0.8 | 1.0 | 1.3 | 0.9 | 0.0 | 1.1 | 1.1 | 0.0 |
| 2019 | ||||||||||||
| January | 3.1 | 3.5 | 4.3 | 5.4 | 0.2 | 1.3 | 1.3 | 0.4 | 0.0 | 1.0 | 0.9 | 0.0 |
| February | 2.4 | 3.0 | 4.1 | 0.9 | 0.2 | 1.0 | 1.7 | 0.0 | 0.0 | 0.8 | 1.1 | 0.0 |
| March | 2.3 | 2.5 | 4.1 | 0.0 | 0.3 | 1.3 | 1.4 | 0.0 | 0.2 | 0.4 | 1.1 | 0.2 |
| April | 1.7 | 1.8 | 4.1 | 0.0 | 0.1 | 1.3 | 1.3 | 0.0 | 0.5 | 0.4 | 1.2 | 1.2 |
| May | 1.1 | 2.7 | 4.0 | 0.0 | 0.1 | 0.8 | 1.7 | 0.0 | 0.5 | 0.2 | 1.1 | 0.0 |
| June | 1.2 | 2.4 | 4.4 | 0.0 | 0.1 | 1.1 | 1.6 | 0.0 | 1.0 | 0.0 | 1.1 | 0.0 |
| July | 1.3 | 2.8 | 4.7 | 0.0 | 0.4 | 1.1 | 1.4 | 0.0 | 0.3 | 0.5 | 1.2 | 0.0 |
| August | 1.5 | 3.1 | 4.6 | 0.3 | 0.4 | 1.4 | 1.3 | 0.1 | 0.3 | 0.2 | 1.2 | 0.0 |
| September | 0.8 | 3.7 | 4.8 | 2.8 | 0.3 | 1.2 | 1.6 | 0.0 | 0.2 | 0.3 | 1.1 | 0.0 |
| October | 2.2 | 3.8 | 5.0 | 1.7 | 0.4 | 0.9 | 2.0 | 0.0 | 0.4 | 0.2 | 1.3 | 1.5 |
| November | 2.6 | 3.6 | 5.2 | 0.0 | 0.3 | 1.4 | 2.0 | 0.5 | 0.7 | 0.7 | 1.3 | 1.6 |
| December | 3.1 | 3.1 | 4.8 | 2.0 | 0.5 | 1.0 | 2.2 | 1.5 | 0.8 | 0.7 | 1.2 | 1.7 |
| 2020 | ||||||||||||
| January | 3.4 | 3.8 | 4.2 | 3.4 | 0.6 | 0.6 | 2.3 | 0.7 | 0.8 | 0.0 | 1.4 | 1.0 |
| February | 3.0 | 4.0 | 4.1 | 2.5 | 0.8 | 0.4 | 2.2 | 0.0 | 0.4 | 0.7 | 1.2 | 0.0 |
| March | 4.9 | 4.8 | 6.5 | 0.0 | 1.3 | 0.5 | 3.4 | 1.0 | 1.0 | 1.4 | 2.4 | 0.0 |
| April | 5.5 | 7.8 | 9.5 | 0.0 | 2.4 | 1.8 | 5.8 | 0.4 | 1.1 | 3.0 | 5.1 | 0.0 |
| May | 5.2 | 7.7 | 9.4 | 2.2 | 1.9 | 1.4 | 5.2 | 0.4 | 0.4 | 2.1 | 4.3 | 0.0 |
| June | 3.6 | 6.3 | 7.4 | 2.0 | 1.6 | 0.8 | 3.4 | 0.0 | 0.0 | 1.1 | 3.4 | 0.0 |
| July | 3.1 | 4.7 | 7.0 | 0.8 | 0.6 | 1.0 | 3.3 | 0.0 | 0.0 | 1.5 | 2.8 | 0.0 |
| August | 3.2 | 3.8 | 6.7 | 0.0 | 0.3 | 0.8 | 3.3 | 0.0 | 0.0 | 0.7 | 2.5 | 0.0 |
| September | 0.9 | 1.8 | 2.4 | 0.0 | 0.0 | 0.0 | 1.5 | 0.0 | 0.0 | 0.0 | 0.8 | 0.0 |
| October | 0.0 | 0.0 | 0.0 | 0.5 | 0.0 | 0.0 | 0.0 | 0.0 | 0.0 | 0.0 | 0.0 | 0.0 |
| November | 0.2 | 0.0 | 0.1 | 0.2 | 0.0 | 0.0 | 0.0 | 0.0 | 0.0 | 0.0 | 0.0 | 0.0 |
| December | 1.5 | 0.9 | 2.9 | 0.0 | 0.0 | 0.1 | 1.0 | 0.2 | 0.4 | 0.0 | 0.0 | 0.0 |
| 2021 | ||||||||||||
| January | 1.9 | 2.9 | 4.0 | 1.0 | 0.4 | 0.0 | 1.1 | 0.0 | 0.4 | 0.0 | 0.0 | 0.0 |
| February | 2.3 | 3.3 | 3.6 | 5.5 | 0.2 | 0.0 | 1.3 | 0.0 | 0.3 | 0.3 | 0.2 | 0.0 |
| March | 2.6 | 2.4 | 4.5 | 4.9 | 0.3 | 0.7 | 1.1 | 0.0 | 0.2 | 0.6 | 0.3 | 1.0 |
| April | 1.5 | 3.5 | 4.0 | 3.9 | 0.4 | 0.5 | 1.8 | 0.0 | 0.2 | 0.5 | 0.4 | 2.1 |
| May | 2.5 | 3.1 | 4.5 | 2.5 | 0.2 | 0.3 | 2.2 | 0.3 | 0.5 | 0.9 | 0.5 | 3.7 |
| June | 2.0 | 3.0 | 3.0 | 4.8 | 0.7 | 0.6 | 1.3 | 0.0 | 0.0 | 0.5 | 0.8 | 3.2 |
| July | 1.7 | 1.8 | 2.7 | 4.6 | 0.1 | 0.7 | 1.2 | 0.6 | 0.0 | 0.0 | 1.5 | 1.5 |
| August | 1.0 | 2.1 | 3.7 | 2.9 | 0.2 | 1.3 | 1.3 | 0.6 | 0.0 | 0.0 | 1.5 | 0.0 |
| September | 1.2 | 3.0 | 3.8 | 3.8 | 0.3 | 1.0 | 1.6 | 0.7 | 0.0 | 0.0 | 2.0 | 0.0 |
| October | 3.2 | 2.0 | 3.8 | 6.5 | 0.3 | 0.9 | 1.4 | 0.5 | 0.0 | 0.3 | 1.2 | 0.0 |
| November | 2.3 | 2.6 | 2.9 | 8.3 | 0.1 | 1.2 | 1.0 | 0.0 | 0.0 | 0.7 | 1.0 | 0.0 |
| December | 1.4 | 3.3 | 3.9 | 6.6 | 0.1 | 0.9 | 1.3 | 0.2 | 0.0 | 0.6 | 1.2 | 0.0 |
| 2022 | ||||||||||||
| January | 1.8 | 3.4 | 5.0 | 4.5 | 0.3 | 1.1 | 1.6 | 1.0 | 0.0 | 0.7 | 0.8 | 0.0 |
| February | 2.4 | 3.5 | 3.6 | 3.7 | 0.1 | 0.9 | 1.0 | 1.7 | 0.2 | 0.9 | 0.7 | 0.0 |
| March | 2.2 | 4.2 | 3.4 | 3.2 | 0.0 | 1.2 | 1.1 | 1.1 | 0.8 | 1.1 | 0.2 | 0.2 |
| April | 0.9 | 4.4 | 3.0 | 2.3 | 0.0 | 1.3 | 0.8 | 1.4 | 0.7 | 0.7 | 0.8 | 0.0 |
| May | 0.1 | 3.7 | 3.9 | 1.0 | 0.0 | 1.3 | 0.9 | 1.9 | 1.0 | 0.2 | 1.3 | 0.0 |
| June | 2.0 | 3.7 | 3.9 | 0.0 | 0.0 | 1.0 | 1.4 | 0.7 | 0.5 | 1.2 | 1.1 | 0.0 |
| July | 2.4 | 4.0 | 2.8 | 1.2 | 0.0 | 1.0 | 0.9 | 1.1 | 1.1 | 1.2 | 0.8 | 0.0 |
| August | 2.4 | 3.5 | 4.1 | 1.1 | 0.0 | 0.9 | 1.7 | 0.6 | 0.6 | 1.3 | 0.9 | 0.2 |
| September | 3.5 | 4.2 | 4.1 | 2.7 | 0.1 | 0.9 | 1.3 | 0.0 | 0.1 | 1.2 | 1.3 | 0.6 |
| October | 3.1 | 3.6 | 4.4 | 2.4 | 0.0 | 1.2 | 1.3 | 0.5 | 0.4 | 1.1 | 1.3 | 1.6 |
| November | 4.2 | 3.4 | 3.7 | 2.4 | 0.2 | 1.2 | 1.3 | 1.5 | 0.0 | 1.5 | 1.1 | 2.0 |
| December | 3.5 | 3.1 | 3.2 | 4.2 | 0.5 | 1.2 | 1.2 | 2.0 | 0.3 | 0.7 | 1.0 | 0.9 |
| 2023 | ||||||||||||
| January | 2.9 | 2.4 | 3.4 | 3.7 | 0.5 | 0.9 | 0.8 | 1.3 | 0.0 | 1.0 | 0.8 | 1.5 |
| February | 2.3 | 2.7 | 3.3 | 2.8 | 0.5 | 1.4 | 0.5 | 2.4 | 0.0 | 0.3 | 0.7 | 0.0 |
| March | 1.8 | 1.4 | 3.5 | 2.6 | 0.5 | 1.1 | 0.9 | 3.0 | 0.0 | 0.2 | 0.7 | 0.3 |
| April | 2.6 | 2.0 | 3.4 | 3.5 | 0.8 | 0.7 | 1.2 | 2.6 | 0.0 | 0.2 | 0.8 | 0.0 |
| May | 2.1 | 3.0 | 3.5 | 4.1 | 0.3 | 0.5 | 1.2 | 1.7 | 0.0 | 0.0 | 1.0 | 1.2 |
| June | 2.1 | 2.4 | 4.1 | 4.1 | 0.0 | 0.9 | 1.1 | 1.0 | 0.0 | 0.0 | 0.7 | 2.7 |
| July | 1.7 | 3.0 | 3.7 | 2.9 | 0.0 | 0.9 | 1.6 | 0.2 | 0.0 | 0.0 | 0.9 | 1.9 |
| August | 1.9 | 3.2 | 3.1 | 3.3 | 0.0 | 0.2 | 1.5 | 0.0 | 0.1 | 0.5 | 1.2 | 3.3 |
| September | 1.5 | 3.8 | 3.0 | 2.7 | 0.0 | 0.6 | 1.4 | 0.0 | 0.5 | 0.9 | 1.2 | 2.6 |
| October | 1.2 | 3.5 | 2.7 | 2.2 | 0.1 | 0.5 | 1.1 | 0.0 | 0.9 | 0.8 | 1.0 | 1.4 |
| November | 1.4 | 2.7 | 2.7 | 2.5 | 0.3 | 0.6 | 1.0 | 0.0 | 0.6 | 0.8 | 0.6 | 0.1 |
| December | 1.5 | 3.2 | 2.5 | 2.7 | 0.2 | 0.7 | 0.7 | 0.0 | 0.2 | 1.1 | 0.8 | 0.8 |
| 2024 | ||||||||||||
| January | 1.7 | 2.8 | 2.7 | 2.3 | 0.1 | 0.9 | 1.1 | 0.0 | 0.0 | 0.7 | 0.6 | 1.0 |
| February | 2.0 | 2.5 | 2.8 | 2.6 | 0.1 | 0.9 | 1.3 | 0.9 | 0.0 | 0.6 | 0.7 | 0.0 |
| March | 1.5 | 2.3 | 2.9 | 1.1 | 0.1 | 0.8 | 1.0 | 1.2 | 0.0 | 0.3 | 0.9 | 0.0 |
| April | 1.6 | 2.3 | 2.8 | 0.0 | 0.0 | 1.1 | 0.9 | 2.5 | 0.0 | 0.1 | 0.9 | 0.0 |
| May | 2.0 | 2.6 | 2.7 | 0.0 | 0.2 | 1.3 | 1.0 | 3.1 | 0.0 | 0.8 | 0.9 | 0.0 |
| June | 2.5 | 2.9 | 2.6 | 0.0 | 0.5 | 1.0 | 1.1 | 2.5 | 0.1 | 0.6 | 1.1 | 0.0 |
| July | 1.9 | 3.0 | 2.6 | 0.3 | 0.8 | 0.8 | 0.8 | 1.0 | 0.4 | 1.4 | 1.2 | 0.0 |
| August | 2.0 | 3.0 | 2.9 | 1.9 | 0.7 | 0.8 | 0.4 | 0.5 | 0.6 | 1.1 | 1.0 | 0.0 |
| September | 2.7 | 2.6 | 2.9 | 2.3 | 1.0 | 0.8 | 0.8 | 0.0 | 0.2 | 0.9 | 0.9 | 0.0 |
| October | 3.0 | 2.6 | 3.2 | 3.0 | 1.0 | 0.9 | 1.0 | 0.0 | 0.5 | 1.2 | 1.0 | 1.8 |
| November | 2.5 | 2.7 | 3.6 | 2.9 | 0.9 | 0.5 | 1.0 | 0.0 | 0.8 | 0.5 | 1.3 | 0.6 |
| December | 2.3 | 2.0 | 3.8 | 4.4 | 0.7 | 0.3 | 1.1 | 0.0 | 0.5 | 0.6 | 1.5 | 1.3 |
| 2025 | ||||||||||||
| January | 3.1 | 2.6 | 3.4 | 4.1 | 0.5 | 0.3 | 1.0 | 0.0 | 0.8 | 0.0 | 1.7 | 0.0 |
| February | 2.2 | 2.6 | 3.4 | 2.5 | 0.6 | 0.4 | 0.9 | 0.0 | 0.9 | 0.1 | 1.8 | 0.2 |
| March | 2.4 | 2.8 | 3.1 | 4.6 | 0.6 | 0.2 | 0.6 | 1.2 | 1.0 | 0.5 | 1.8 | 0.0 |
| April | 2.1 | 2.8 | 3.2 | 4.8 | 0.6 | 0.3 | 0.7 | 0.9 | 1.0 | 0.6 | 1.4 | 0.2 |
| May | 2.4 | 2.7 | 3.1 | 5.9 | 0.5 | 0.1 | 1.1 | 0.5 | 0.9 | 0.6 | 1.3 | 0.0 |
| June | 1.9 | 3.1 | 3.1 | 4.0 | 0.5 | 0.3 | 1.0 | 1.0 | 0.8 | 0.6 | 0.9 | 0.0 |
| July | 1.9 | 3.1 | 3.2 | 5.0 | 0.5 | 0.6 | 1.2 | 1.8 | 0.5 | 0.7 | 1.0 | 0.0 |
| August | 2.5 | 2.9 | 3.6 | 1.8 | 0.4 | 0.4 | 1.7 | 0.0 | 0.4 | 0.4 | 0.6 | 0.0 |
| September | 2.3 | 3.1 | 3.4 | 0.0 | 0.2 | 0.4 | 1.9 | 0.0 | 0.4 | 0.4 | 0.7 | 0.0 |
| October | 1.8 | 3.2 | 3.6 | 0.0 | 0.1 | 0.2 | 1.8 | 0.0 | 0.0 | 0.1 | 1.0 | 0.0 |
| November | 1.7 | 3.2 | 3.1 | 0.0 | 0.0 | 0.9 | 1.4 | 0.0 | 0.0 | 0.5 | 1.0 | 0.1 |
| December | 1.7 | 3.7 | 2.9 | 0.0 | 0.3 | 0.8 | 1.6 | 0.0 | 0.0 | 0.2 | 0.6 | 0.0 |
| 2026 | ||||||||||||
| January | 1.7 | 3.4 | 3.3 | 0.0 | 0.5 | 0.8 | 1.5 | 0.0 | 0.0 | 1.0 | 0.0 | 0.7 |
| February | 1.6 | 4.3 | 3.3 | 1.2 | 0.6 | 0.9 | 1.4 | 0.7 | 0.0 | 1.1 | 0.5 | 0.7 |
| March | 1.6 | 4.1 | 3.6 | 2.9 | 0.3 | 1.3 | 1.4 | 1.4 | 0.0 | 1.1 | 0.3 | 1.4 |
| April | 2.4 | 4.2 | 3.3 | 2.6 | 0.2 | 1.3 | 1.5 | 0.2 | 0.0 | 1.1 | 0.5 | 1.8 |
| May | 2.5 | 4.0 | 3.8 | 3.5 | 0.6 | 1.3 | 1.0 | 0.8 | 0.0 | 0.8 | 0.5 | 0.9 |
| June | 3.5 | 2.9 | 3.9 | 3.6 | 0.5 | 1.2 | 0.7 | 0.4 | 0.1 | 1.2 | 1.1 | 0.9 |
| July | 2.9 | 2.8 | 3.7 | 3.2 | 0.0 | 1.3 | 0.7 | 0.8 | 0.2 | 1.1 | 1.7 | 0.0 |
| August | 2.1 | 2.7 | 3.5 | 3.5 | 0.3 | 1.3 | 0.2 | 1.2 | 0.4 | 0.5 | 1.5 | 0.0 |
Conclusion
There is no broad evidence that the rise of AI has led to substantial decreases in hiring or increases in job separation rates in Canada so far, even for younger workers and those in occupations potentially more amenable to AI substitution. Hiring and job separation rates observed from the six months leading up to November 2022—when ChatGPT publicly launched—to the six months leading up to August 2026 were generally within historical ranges or represented a continuation of pre-existing trends.
Mehdi and Frenette (2026) found that employment growth for younger workers was relatively weak in the post-pandemic period, regardless of potential occupational exposure to AI. The findings of the current article suggest that this pattern may have been driven primarily by slower hiring (a continuation of earlier trends), rather than faster job separations.Note
These insights represent early evidence and complement those of Mehdi and Frenette (2026) regarding the evolution of the Canadian labour market amid not just technological changes but a confluence of other economic forces. As AI adoption accelerates, it will be essential to continue monitoring labour market trends to better understand how technological changes are reshaping the economy—and for whom.
Authors
Tahsin Mehdi and Marc Frenette are with the Economic and Social Analysis and Modelling Division, Analytical Studies and Modelling Branch, at Statistics Canada.
Acknowledgements
The authors would like to thank Ryan Macdonald, André Bernard and Ping Ching Winnie Chan from Statistics Canada, and René Morissette from the Université du Québec en Outaouais for their helpful comments and suggestions.
References
Brouillette, D., T. Dahlhaus and G. Galassi. 2026. Early Signs of AI-driven Adjustments in Canada’s Labour Market. Sparks at Bank Article. Bank of Canada. https://www.bankofcanada.ca/2026/08/sparks-at-bank-article-2026-19/.
Brynjolfsson, E., B. Chandar and R. Chen. 2025. Canaries in the Coal Mine? Six Facts about the Recent Employment Effects of Artificial Intelligence. Stanford University Working Paper. https://digitaleconomy.stanford.edu/publications/canaries-in-the-coal-mine.
Budget Lab. 2026. Tracking the Impact of AI on the Labor Market. Yale University. https://budgetlab.yale.edu/research/tracking-impact-ai-labor-market.
Carioli, P., D. Czarnitzki and G. P. Fernández. 2026. Evidence on the Adoption of Artificial Intelligence: The Role of Skills Shortage. IZA Discussion Paper, No. 18793. https://www.iza.org/publications/dp/18793/evidence-on-the-adoption-of-artificial-intelligence-the-role-of-skills-shortage.
Crane, L. D. and P. E. Soto. 2026. AI and Coder Employment: Compiling the Evidence. Federal Reserve System, Finance and Economics Discussion Series. https://doi.org/10.17016/FEDS.2026.018.
Davenport, T. H. and L. Srinivasan. 2026. Companies Are Laying Off Workers Because of AI’s Potential—Not Its Performance. Harvard Business Review. https://hbr.org/2026/01/companies-are-laying-off-workers-because-of-ais-potential-not-its-performance.
Do, V., S. Sood and C. Johnston. 2026. Analysis on Artificial Intelligence Use by Businesses in Canada, Second Quarter of 2026. Analysis in Brief. Statistics Canada Catalogue no. 11‑621‑M. https://www150.statcan.gc.ca/n1/pub/11-621-m/11-621-m2026010-eng.htm.
Eckhardt, S. and N. Goldschlag. 2025. AI and Jobs: The Final Word (Until the Next One). Economic Innovation Group. https://eig.org/ai-and-jobs-the-final-word. https://doi.org/10.1002/smj.3286.
Felten, E., M. Raj and R. Seamans. 2021. Occupational, Industry, and Geographic Exposure to Artificial Intelligence: A Novel Dataset and its Potential Uses. Strategic Management Journal 42(12): 2195-2217. https://doi.org/10.1002/smj.3286.
Filippucci, F., P. Gal, C. Jona-Lasinio, A. Leandro and G. Nicoletti. 2024. The Impact of Artificial Intelligence on Productivity, Distribution and Growth: Key Mechanisms, Initial Evidence and Policy Challenges. OECD Artificial Intelligence Papers, No. 15. OECD Publishing, Paris. https://doi.org/10.1787/8d900037-en.
Hahmann, T. and M. Lovei. 2026. Workplace Artificial Intelligence Use: A Profile of Sociodemographic and Job Characteristics. Insights on Canadian Society. Statistics Canada Catalogue no. 75-006-X. https://www150.statcan.gc.ca/n1/pub/75-006-x/2026001/article/00007-eng.htm.
Hosseini Maasoum, S. M. and G. Lichtinger. 2025. Generative AI as Seniority-Biased Technological Change: Evidence from U.S. Résumé and Job Posting Data. Social Science Research Network. https://dx.doi.org/10.2139/ssrn.5425555.
Iscenko, Z. and F. C. Millet. 2026. Looking for the Ladder: Is AI Impacting Entry-Level Jobs? Economic Innovation Group. https://eig.org/wp-content/uploads/2026/01/TAWP-Iscenko-Millet.pdf.
Leanage, A. and T. Mehdi. 2026. Potential Occupational Exposure to Artificial Intelligence and Automation Among Certified Journeypersons in Canada. Economic and Social Reports (January). Statistics Canada Catalogue no. 36-28-0001. https://doi.org/10.25318/36280001202600100001-eng.
Li, V. and G. Dobbs. 2025. Right Brain, Left Brain, AI Brain: AI’s Impact on Jobs and Skill Demand in Canada’s Workforce. The Dais. https://dais.ca/reports/right-brain-left-brain-ai-brain.
Mehdi, T., R. Allen, J. Lesica and J. Watt. 2026. Potential Occupational Exposure to Artificial Intelligence Across Selected Cultural Industries in Canada. Economic and Social Reports (March). Statistics Canada Catalogue no. 36-28-0001. https://doi.org/10.25318/36280001202600300003-eng.
Mehdi, T. and M. Frenette. 2024. Exposure to Artificial Intelligence in Canadian Jobs: Experimental Estimates. Economic and Social Reports (September). Statistics Canada Catalogue no. 36‑28-0001. https://doi.org/10.25318/36280001202400900004-eng.
Mehdi, T. and M. Frenette. 2026. Canadian Employment Trends in the Era of Generative Artificial Intelligence: Early Evidence. Economic and Social Reports (January). Statistics Canada Catalogue no. 36-28-0001. https://doi.org/10.25318/36280001202600100003-eng.
Mehdi, T. and R. Morissette. 2024. Experimental Estimates of Potential Artificial Intelligence Occupational Exposure in Canada. Analytical Studies Branch Research Paper Series. Statistics Canada Catalogue no. 11F0019M. https://doi.org/10.25318/11f0019m2024005-eng.
Morissette, R., W. Ci and G. Schellenberg. 2016. Hiring and Layoff Rates by Economic Region of Residence: Data Quality, Concepts and Methods. Analytical Studies: Methods and References. Statistics Canada Catalogue no. 11-633-X. https://www150.statcan.gc.ca/n1/pub/11-633-x/11-633-x2016001-eng.htm.
Morissette, R., Y. Lu and T. Qiu. 2013. Worker Reallocation in Canada. Analytical Studies Branch Research Paper Series. Statistics Canada Catalogue no. 11F0019M. https://www150.statcan.gc.ca/n1/pub/11f0019m/11f0019m2013348-eng.htm.
Pizzinelli, C., A. J. Panton, M. M. Tavares, M. Cazzaniga and L. Li. 2023. Labor Market Exposure to AI: Cross-country Differences and Distributional Implications. IMF Working Paper no. 216. Washington, D.C.: International Monetary Fund. https://www.imf.org/en/Publications/WP/Issues/2023/10/04/Labor-Market-Exposure-to-AI-Cross-country-Differences-and-Distributional-Implications-539656.
Statistics Canada. 2026a. Use of Generative Artificial Intelligence Tools Among Canadian Workers, March 2026. The Daily, Statistics Canada. https://www150.statcan.gc.ca/n1/daily-quotidien/260730/dq260730b-eng.htm.
Statistics Canada. 2026b. Labour Force Survey, June 2026. https://www150.statcan.gc.ca/n1/daily-quotidien/260710/dq260710a-eng.htm.